Quantcast
Channel: DailyFinance.com
Viewing all 9760 articles
Browse latest View live

dELiA*s Announces Proposed Underwritten Public Offering of Common Stock

$
0
0

Filed under:

dELiA*s Announces Proposed Underwritten Public Offering of Common Stock

NEW YORK--(BUSINESS WIRE)-- dELiA*s, Inc. (Nasdaq: DLIA) (the "Company"), a multi-channel retail company primarily marketing to teenage girls, today announced that it has commenced an underwritten public offering of its common stock pursuant to its existing shelf registration statement. The Company also expects to grant the underwriters a 30-day option to purchase additional shares of common stock to cover over-allotments, if any. The offering is expected to close on or about July 31, 2013. The offering is subject to market conditions, and there can be no assurance as to whether or when the offering may be completed, or as to the actual size or terms of the offering.

Janney Montgomery Scott LLC is acting as sole book-running manager for the offering.


The securities described above are being offered by the Company pursuant to a shelf registration statement on Form S-3 (Registration No. 333-182236), including a base prospectus dated September 7, 2012, previously filed with and declared effective by the Securities and Exchange Commission (the "SEC"). A preliminary prospectus supplement related to the offering has been filed with the SEC and is available on the SEC's website located at http://www.sec.gov. Copies of the preliminary prospectus supplement and the accompanying base prospectus relating to this offering may be obtained from Janney Montgomery Scott LLC, 60 State Street, Boston, MA 02109, Attention: Equity Syndicate Department or via email at prospectus@janney.com.

Investors are advised to read the base prospectus, prospectus supplement, registration statement, and other documents that the Company has filed with the SEC for more complete information about the Company and this offering. Investors may obtain these documents for free by visiting the SEC's website at http://www.sec.gov.

This news release shall not constitute an offer to sell or the solicitation of an offer to buy, nor shall there be any sale of these securities in any state or jurisdiction in which such offer, solicitation or sale would be unlawful prior to registration or qualification under the securities laws of any such state or jurisdiction.

About dELiA*s, Inc.

dELiA*s, Inc. is a multi-channel retail company primarily marketing to teenage girls. It generates revenue by selling apparel, accessories and footwear to consumers through its website, direct mail catalogs, and mall-based retail stores.

Forward-Looking Statements

All statements included in this press release, other than statements of historical fact, are forward-looking statements within the meaning of Section 27A of the Securities Act of 1933, as amended. Forward-looking statements can generally be identified by words such as "may," "could," "will," "should," "assume," "expect," "anticipate," "plan," "intend," "believe," "predict," "estimate," "forecast," "outlook," "potential," or "continue," or the negative of these terms, and other comparable terminology, and include statements regarding the anticipated use of proceeds from the offering. Although we believe the expectations and intentions reflected in our forward-looking statements are reasonable, we cannot assure you that these expectations and intentions will prove to be correct.

Various risks and other factors including those risks and uncertainties identified in the "Risk Factors" section of the preliminary prospectus supplement filed with the SEC could cause actual results, and actual events that occur, to differ materially from those contemplated by the forward-looking statements.

Many of the risk factors are beyond our ability to control or predict. You should not unduly rely on any of our forward-looking statements. These statements are made only as of the date of this press release. Except as required by law, we are not obligated to publicly release any revisions to these forward-looking statements to reflect future events or developments. All subsequent written and oral forward-looking statements attributable to us and persons acting on our behalf are qualified in their entirety by the cautionary statements contained herein or in our public filings.


dELiA*s, Inc.
David Dick, 212-590-6200
Chief Financial Officer
or
ICR
Jean Fontana, 646-277-1214

KEYWORDS:   United States  North America  New York

INDUSTRY KEYWORDS:

The article dELiA*s Announces Proposed Underwritten Public Offering of Common Stock originally appeared on Fool.com.

Try any of our Foolish newsletter services free for 30 days. We Fools may not all hold the same opinions, but we all believe that considering a diverse range of insights makes us better investors. The Motley Fool has a disclosure policy.

Copyright © 1995 - 2013 The Motley Fool, LLC. All rights reserved. The Motley Fool has a disclosure policy.


Read | Permalink | Email this | Linking Blogs | Comments


FleetCor Signs Partnership Agreement with Visa Europe

$
0
0

Filed under:

FleetCor Signs Partnership Agreement with Visa Europe

NORCROSS, Ga.--(BUSINESS WIRE)-- FleetCor Technologies, Inc. (NYS: FLT) , a leading global provider of fuel cards and workforce payment products to businesses, announced today that it has signed a long-term agreement with Visa Europe.

Under the terms of this new agreement, FleetCor will utilize its Global FleetNet ("GFN") fuel card processing system together with Visa Europe's EMV standard chip and PIN intelligent technology to deliver new fuel card solutions across Visa Europe territories.


The companies plan to develop new fuel card propositions together with the first planned implementation in FleetCor's Allstar business in the UK.

Allstar will be the first to offer this Visa Europe chip and PIN technology in the commercial fuel card space.

This Allstar fuel card implementation will create new benefits for Allstar's commercial clients, including:

  • Enhanced security and fraud protection: The chip technology will make fuel cards nearly impossible to clone
  • Enhanced convenience: The Allstar cards will be usable both inside the shop and outside at the pump
  • Enhanced control: The cards will have improved purchasing restrictions to eliminate the purchase of non-approved fuel grades or other out-of-policy items

"We are excited to combine our specialized fuel card expertise with Visa Europe's intelligent EMV chip technology to help us further capture more European fuel card spend," said Ron Clarke, FleetCor's Chairman and CEO.

Steve Price, Head of Business Development at Visa Europe, commented, "We are delighted to have concluded a partnership with FleetCor to deliver products to the fleet and fuel card marketplace. We believe there is a real need for new solutions that help reduce costs and extend payment functionality. The combination of Visa's payments expertise together with FleetCor's specialist fuel industry expertise makes for a powerful combination. I look forward to extending the partnership beyond this first implementation."

Forward-Looking Statements

This press release contains forward-looking statements within the meaning of the federal securities laws. Statements that are not historical facts, including statements about FleetCor's beliefs, expectations and future performance, are forward-looking statements. Forward-looking statements can be identified by the use of words such as "anticipate," "intend," "believe," "estimate," "plan," "seek," "project" or "expect," "may," "will," "would," "could" or "should," the negative of these terms or other comparable terminology. Examples of forward-looking statements in this press release include statements relating to the delivery of new fuel card solutions, planned implementation, and the creation of new benefits for commercial clients. These forward-looking statements are subject to a number of risks and uncertainties that could cause actual results to differ materially from those contained in any forward-looking statement, such as the risks and uncertainties identified under the caption "Risk Factors" in FleetCor's Annual Report on Form 10-K for the year ended December 31, 2012, filed with the Securities and Exchange Commission on March 1, 2013. FleetCor believes these forward-looking statements are reasonable; however, forward-looking statements are not a guarantee of performance, and undue reliance should not be placed on such statements. The forward-looking statements included in this press release are made only as of the date hereof, and FleetCor does not undertake, and specifically disclaims, any obligation to update any such statements or to publicly announce the results of any revisions to any of such statements to reflect future events or developments.

About FleetCor

FleetCor is a leading global provider of fuel cards and workforce payment products to businesses. FleetCor' s payment programs enable businesses to better control employee spending and provide card-accepting merchants with a high volume customer base that can increase their sales and customer loyalty. FleetCor serves commercial accounts in North America, Latin America, Europe, and Australia/New Zealand. For more information, please visit http://www.fleetcor.com.

About Visa Europe

Visa Europe is a payments technology business owned and operated by member banks and other payment service providers from 36 countries across Europe.

Visa Europe works at the forefront of technology to create the services and infrastructure which enable millions of European consumers, businesses and governments to make electronic payments. Its members are responsible for issuing cards, signing up retailers and deciding cardholder and retailer fees.

Since 2004, Visa Europe has been independent of Visa Inc. and incorporated in the UK, with an exclusive, irrevocable and perpetual licence in Europe.

For more information, please visit www.visaeurope.com


FleetCor
Investor Relations
770-729-2017
investor@fleetcor.com

KEYWORDS:   United States  Europe  North America  Georgia

INDUSTRY KEYWORDS:

The article FleetCor Signs Partnership Agreement with Visa Europe originally appeared on Fool.com.

Try any of our Foolish newsletter services free for 30 days. We Fools may not all hold the same opinions, but we all believe that considering a diverse range of insights makes us better investors. The Motley Fool has a disclosure policy.

Copyright © 1995 - 2013 The Motley Fool, LLC. All rights reserved. The Motley Fool has a disclosure policy.


Read | Permalink | Email this | Linking Blogs | Comments
Masonite to Webcast Discussion of 2013 Second Quarter Results on August 8, 2013

$
0
0

Filed under:

Masonite to Webcast Discussion of 2013 Second Quarter Results on August 8, 2013

TAMPA, Fla.--(BUSINESS WIRE)-- Masonite International Corporation will webcast a discussion of its 2013 second quarter and year to date results on Thursday, August 8, 2013 beginning at 10:00 a.m. (Eastern Time). President and Chief Executive Officer Fred Lynch and Executive Vice President and Chief Financial Officer Mark Erceg will discuss the results via the live webcast.

The webcast can be accessed at: 2Q2013 Earnings Webcast.


Telephone access to the live call will be available at 877-407-3980 (in the U.S.) or by dialing 201-689-8475 (outside U.S.).

A telephone replay will be available approximately one hour following completion of the call through August 18, 2013. To access the replay, please dial 877-660-6853 (in the U.S.) or 201-612-7415 (outside U.S.). Enter Conference ID #418425.

About Masonite

Masonite International Corporation is a leading global designer and manufacturer of interior and exterior doors for the residential new construction; the residential repair, renovation and remodeling; and the non-residential building construction markets. Since 1925, Masonite has provided its customers with innovative products and superior service at compelling values. Masonite currently serves more than 6,000 customers in 70 countries. Additional information about Masonite can be found at www.masonite.com.


Masonite International Corporation
Joanne Freiberger, 813-739-1808
Vice President and Treasurer
investorrelations@masonite.com

KEYWORDS:   United States  North America  Canada  Florida

INDUSTRY KEYWORDS:

The article Masonite to Webcast Discussion of 2013 Second Quarter Results on August 8, 2013 originally appeared on Fool.com.

Try any of our Foolish newsletter services free for 30 days. We Fools may not all hold the same opinions, but we all believe that considering a diverse range of insights makes us better investors. The Motley Fool has a disclosure policy.

Copyright © 1995 - 2013 The Motley Fool, LLC. All rights reserved. The Motley Fool has a disclosure policy.


Read | Permalink | Email this | Linking Blogs | Comments
World Energy Use to Rise 56% by 2040

$
0
0

Filed under:

World energy use is expected to increase 56% between 2010 and 2040, according to the Energy Information Administration's (EIA) newly released International Energy Outlook 2013.

In a shift from the status quo, demand over the next three decades will overwhelmingly originate from developing and emerging economies. Non-OECD countries are expected to increase energy consumption by 90%, compared to just 17% for OECD countries. Worldwide, industries are expected to continue to consume more than half of total energy demanded.


Source: EIA.gov 

The EIA made sure to note in its latest report that the recovery from the 2008-2009 global recession introduces a large measure of uncertainty into any long-term predictions. World energy markets are highly dependent on the overall economy, and vice versa. The Administration specifically notes debt issues in the U.S. and Europe, as well as China and India's recent slowing in GDP growth.

The article World Energy Use to Rise 56% by 2040 originally appeared on Fool.com.

Y ou can follow Justin Loiseau on Twitter @TMFJLo and on Motley Fool CAPS @TMFJLo. Try any of our Foolish newsletter services free for 30 days. We Fools don't all hold the same opinions, but we all believe that considering a diverse range of insights makes us better investors. The Motley Fool has a disclosure policy.

Copyright © 1995 - 2013 The Motley Fool, LLC. All rights reserved. The Motley Fool has a disclosure policy.


Read | Permalink | Email this | Linking Blogs | Comments
Why Under Armour Shares Bulked Up

$
0
0

Filed under:

Although we don't believe in timing the market or panicking over market movements, we do like to keep an eye on big changes -- just in case they're material to our investing thesis.

What: Shares of Under Armour  flexed their muscles in a big way today, finishing the trading session with a 12% gain after Under Armour beat analyst expectations on both top and bottom lines, before the opening bell.

So what: The fitness-apparel company posted revenue of $454.5 million for its second quarter, a 23% year-over-year improvement that came in above Wall Street's $449-million consensus. Under Armour's earnings of $0.16 per share was also $0.02 better than the consensus. This momentum was good enough for Under Armour to raise its fiscal-year revenue projection to the $2.23 billion to $2.25 billion range, which now bests the Street's $2.24 consensus. Earlier projections in the $2.21 billion to $2.23 billion were not up to snuff in that regard.


Now what: Under Armour has certainly been a great competitor in many investors' portfolios, and shares are once again nudging toward all-time highs. However, the company is hardly cheap with a 60-plus P/E, and the growth of Under Armour's share price has, by now, far exceeded the growth of its earnings over the past five years (and over shorter time frames, as well). Investors should pause to consider whether or not the company can really muster enough earnings growth to catch up with its share price. If not, it could be time to put this stock on the bench.

Want more news and updates? Add Under Armour to your Watchlist now.

Tired of watching your stocks creep up year after year at a glacial pace? Motley Fool co-founder David Gardner, founder of the No. 1 growth stock newsletter in the world, has developed a unique strategy for uncovering truly wealth-changing stock picks. And he wants to share it, along with a few of his favorite growth stock superstars, WITH YOU! It's a special 100% FREE report called "6 Picks for Ultimate Growth." So stop settling for index-hugging gains... and click HERE for instant access to a whole new game plan of stock picks to help power your portfolio.

The article Why Under Armour Shares Bulked Up originally appeared on Fool.com.

Fool contributor Alex Planes has no position in any stocks mentioned. The Motley Fool recommends Under Armour. The Motley Fool owns shares of Under Armour. Try any of our Foolish newsletter services free for 30 days. We Fools may not all hold the same opinions, but we all believe that considering a diverse range of insights makes us better investors. The Motley Fool has a disclosure policy.

Copyright © 1995 - 2013 The Motley Fool, LLC. All rights reserved. The Motley Fool has a disclosure policy.


Read | Permalink | Email this | Linking Blogs | Comments
Why Strayer Education Failed Investors Today

$
0
0

Filed under:

Although we don't believe in timing the market or panicking over market movements, we do like to keep an eye on big changes -- just in case they're material to our investing thesis.

What: Shares of Strayer Education dropped 12% after the company released earnings.

So what: Revenue fell 10% in the second quarter, to $132.0 million, and net income fell 29%, to $15.0 million, or $1.42 per share. Both figures were better than estimates, but the trend of lower enrollment and revenue has investors selling shares today. 


Now what: The most concerning data point is that enrollment was down 13% for the summer term for Strayer. New student enrollment was down a whopping 17%, which doesn't bode well for earnings going forward. Momentum is clearly against the company, and even though shares trade at 12.5 times forward earnings estimates, this stock looks like a value trap to me.

Interested in more info on Strayer Education? Add it to your watchlist by clicking here.

The article Why Strayer Education Failed Investors Today originally appeared on Fool.com.

Fool contributor Travis Hoium has no position in any stocks mentioned. The Motley Fool has no position in any of the stocks mentioned. Try any of our Foolish newsletter services free for 30 days. We Fools may not all hold the same opinions, but we all believe that considering a diverse range of insights makes us better investors. The Motley Fool has a disclosure policy.

Copyright © 1995 - 2013 The Motley Fool, LLC. All rights reserved. The Motley Fool has a disclosure policy.


Read | Permalink | Email this | Linking Blogs | Comments
Why Vertex Earnings Prospects Are So Bright

$
0
0

Filed under:

Vertex Pharmaceuticals will release its quarterly report on Monday, and investors have gotten increasingly excited about its growth prospects in some of its most promising treatments. Even though Vertex earnings aren't likely to turn profitable in the near future, investors believe that the long-term impact of getting its prospects through the pipeline will eventually pay off in big profits.

Vertex Pharmaceuticals has a couple of approved drugs, including its Kalydeco cystic fibrosis drug and its Incivek treatment for hepatitis C. But it also has some promising prospects in the development stage. With the company having reported some positive study results during the quarter, Vertex saw its shares soar as more investors got aboard the biotech's bandwagon. Let's take an early look at what's been happening with Vertex Pharmaceuticals over the past quarter and what we're likely to see in its quarterly report.

Stats on Vertex Pharmaceuticals


Analyst EPS Estimate

($0.18)

Year-Ago EPS

($0.31)

Revenue Estimate

$308.02 million

Change From Year-Ago Revenue

(26%)

Earnings Beats in Past 4 Quarters

0


Source: Yahoo! Finance.

When will prospects pay off for Vertex earnings?
Just looking at analyst expectations, views on Vertex earnings have posted some wild swings in recent months. Analysts have narrowed their loss estimates for the June quarter by $0.04 per share, but they've predicted a loss for the full year that's more than double what they expected a few months back. The stock, though, has soared, rising 57% since mid-April.

Just about all of Vertex's share-price gains came as a result of favorable mid-stage study results in its combination trial of cystic fibrosis treatments. The company has been testing a combination of its previously approved Kalydeco with its developmental drug VX-661, and the April results showed improved lung-exhalation capacity that as much as tripled the improvement of a placebo. With few drugs targeting cystic fibrosis and almost half of patients suffering from the particular mutation that the study targeted, Vertex could well have identified a blockbuster in the space. Moreover, with an ongoing phase 3 trial of another developmental drug, VX-809, in combination with Kalydeco, Vertex has a couple of swings at a new hit.

Yet Vertex faces some trouble in its hepatitis C market. Its approved drug Incivek was seen as a potential blockbuster when it was approved in 2011, but sales have been on the decline. With Gilead Sciences having reported 95% cure rates from its phase 2 trials of its combination hepatitis C treatment involving drugs sofosbuvir and ledipasvir, the prospect of an all-oral combination drug could lead to further declines for the injectable Incivek. Yet Vertex has its own all-oral treatment in studies, and with royalties coming from Johnson & Johnson as a result of their collaboration on the hep C drug Incivo, Vertex gains some greater exposure to international markets where J&J has boosted its availability recently.

In evaluating Vertex earnings, be sure to watch for the latest development-program progress reports. Even though existing drugs provide solid revenue for the company, it'll be essential for Vertex to add new products in order to maintain its success.

It's no secret that biotech stocks have been soaring recently, but the best investment strategy is to pick great companies and stick with them for the long term. The Motley Fool's free report "3 Stocks That Will Help You Retire Rich" not only shares stocks that could help you build long-term wealth but also winning strategies that every investor should know. Click here to grab your free copy today.

Click here to add Vertex Pharmaceuticals to My Watchlist, which can find all of our Foolish analysis on it and all your other stocks.

The article Why Vertex Earnings Prospects Are So Bright originally appeared on Fool.com.

Fool contributor Dan Caplinger has no position in any stocks mentioned. You can follow him on Twitter @DanCaplinger. The Motley Fool recommends Gilead Sciences and Vertex Pharmaceuticals. It recommends and owns shares of Johnson & Johnson. Try any of our Foolish newsletter services free for 30 days. We Fools may not all hold the same opinions, but we all believe that considering a diverse range of insights makes us better investors. The Motley Fool has a disclosure policy.

Copyright © 1995 - 2013 The Motley Fool, LLC. All rights reserved. The Motley Fool has a disclosure policy.


Read | Permalink | Email this | Linking Blogs | Comments
Golf Clap for 3M

$
0
0

Filed under:

3M (NYS: MMM) reported earnings on July 25. Here are the numbers you need to know.

The 10-second takeaway
For the quarter ended June 30 (Q2), 3M met expectations on revenues and met expectations on earnings per share.

Compared to the prior-year quarter, revenue increased slightly. GAAP earnings per share grew.


Margins dropped across the board.

Revenue details
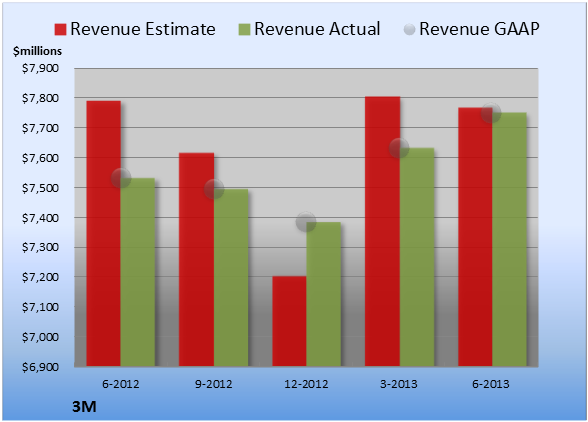
3M reported revenue of $7.75 billion. The 11 analysts polled by S&P Capital IQ expected a top line of $7.77 billion on the same basis. GAAP reported sales were the same as the prior-year quarter's.

Source: S&P Capital IQ. Quarterly periods. Dollar amounts in millions. Non-GAAP figures may vary to maintain comparability with estimates.

EPS details
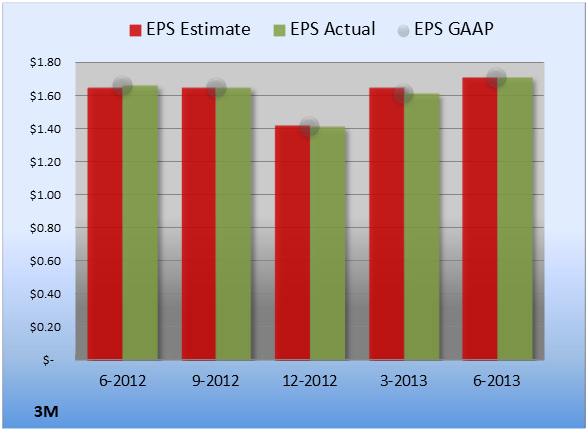
EPS came in at $1.71. The 16 earnings estimates compiled by S&P Capital IQ averaged $1.71 per share. GAAP EPS of $1.71 for Q2 were 3.0% higher than the prior-year quarter's $1.66 per share.

Source: S&P Capital IQ. Quarterly periods. Non-GAAP figures may vary to maintain comparability with estimates.

Margin details
For the quarter, gross margin was 48.2%, 40 basis points worse than the prior-year quarter. Operating margin was 22.0%, 90 basis points worse than the prior-year quarter. Net margin was 15.4%, 10 basis points worse than the prior-year quarter. (Margins calculated in GAAP terms.)

Looking ahead
Next quarter's average estimate for revenue is $7.90 billion. On the bottom line, the average EPS estimate is $1.78.

Next year's average estimate for revenue is $31.06 billion. The average EPS estimate is $6.70.

Investor sentiment
The stock has a five-star rating (out of five) at Motley Fool CAPS, with 4,433 members out of 4,590 rating the stock outperform, and 157 members rating it underperform. Among 1,367 CAPS All-Star picks (recommendations by the highest-ranked CAPS members), 1,350 give 3M a green thumbs-up, and 17 give it a red thumbs-down.

Of Wall Street recommendations tracked by S&P Capital IQ, the average opinion on 3M is hold, with an average price target of $110.19.

Can your portfolio provide you with enough income to last through retirement? You'll need more than 3M. Learn how to maximize your investment income and "Secure Your Future With 9 Rock-Solid Dividend Stocks." Click here for instant access to this free report.

The article Golf Clap for 3M originally appeared on Fool.com.

Seth Jayson had no position in any company mentioned here at the time of publication. You can view his stock holdings here. He is co-advisor of Motley Fool Hidden Gems, which provides new small-cap ideas every month, backed by a real-money portfolio. The Motley Fool recommends 3M and recommends the following options:long January 2014 $65 calls on 3M. Try any of our Foolish newsletter services free for 30 days. We Fools may not all hold the same opinions, but we all believe that considering a diverse range of insights makes us better investors. The Motley Fool has a disclosure policy.

Copyright © 1995 - 2013 The Motley Fool, LLC. All rights reserved. The Motley Fool has a disclosure policy.


Read | Permalink | Email this | Linking Blogs | Comments

Raytheon Crushes Earnings Estimates

$
0
0

Filed under:

Raytheon (NYS: RTN) reported earnings on July 25. Here are the numbers you need to know.

The 10-second takeaway
For the quarter ended June 30 (Q2), Raytheon beat expectations on revenues and crushed expectations on earnings per share.

Compared to the prior-year quarter, revenue expanded slightly. Non-GAAP earnings per share grew significantly. GAAP earnings per share increased.


Gross margins shrank, operating margins grew, net margins increased.

Revenue details
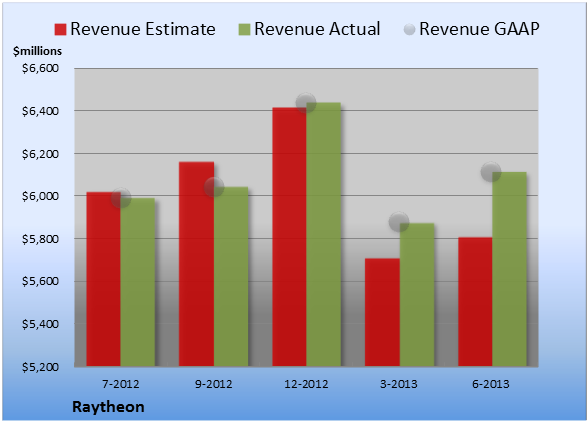
Raytheon booked revenue of $6.12 billion. The 17 analysts polled by S&P Capital IQ foresaw a top line of $5.81 billion on the same basis. GAAP reported sales were the same as the prior-year quarter's.

Source: S&P Capital IQ. Quarterly periods. Dollar amounts in millions. Non-GAAP figures may vary to maintain comparability with estimates.

EPS details
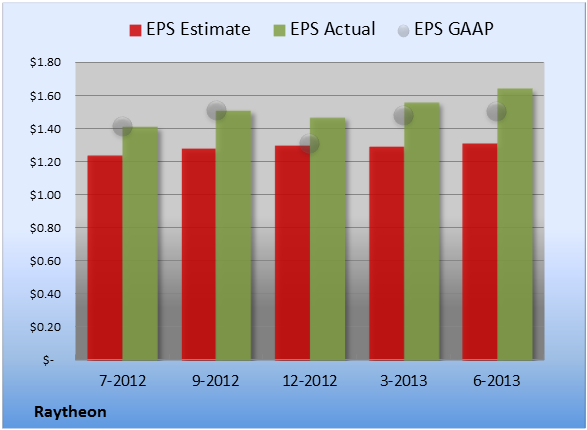
EPS came in at $1.64. The 19 earnings estimates compiled by S&P Capital IQ predicted $1.31 per share. Non-GAAP EPS of $1.64 for Q2 were 16% higher than the prior-year quarter's $1.41 per share. GAAP EPS of $1.50 for Q2 were 6.4% higher than the prior-year quarter's $1.41 per share.

Source: S&P Capital IQ. Quarterly periods. Non-GAAP figures may vary to maintain comparability with estimates.

Margin details
For the quarter, gross margin was 22.3%, 10 basis points worse than the prior-year quarter. Operating margin was 12.5%, 10 basis points better than the prior-year quarter. Net margin was 8.0%, 10 basis points better than the prior-year quarter. (Margins calculated in GAAP terms.)

Looking ahead
Next quarter's average estimate for revenue is $5.84 billion. On the bottom line, the average EPS estimate is $1.31.

Next year's average estimate for revenue is $23.52 billion. The average EPS estimate is $5.44.

Investor sentiment

Of Wall Street recommendations tracked by S&P Capital IQ, the average opinion on Raytheon is hold, with an average price target of $63.53.

Looking for alternatives to Raytheon? It takes more than great companies to build a fortune for the future. Learn the basic financial habits of millionaires next door and get focused stock ideas in our free report, "3 Stocks That Will Help You Retire Rich." Click here for instant access to this free report.

The article Raytheon Crushes Earnings Estimates originally appeared on Fool.com.

Seth Jayson had no position in any company mentioned here at the time of publication. You can view his stock holdings here. He is co-advisor of Motley Fool Hidden Gems, which provides new small-cap ideas every month, backed by a real-money portfolio. The Motley Fool owns shares of Raytheon Company. Try any of our Foolish newsletter services free for 30 days. We Fools may not all hold the same opinions, but we all believe that considering a diverse range of insights makes us better investors. The Motley Fool has a disclosure policy.

Copyright © 1995 - 2013 The Motley Fool, LLC. All rights reserved. The Motley Fool has a disclosure policy.


Read | Permalink | Email this | Linking Blogs | Comments
Golf Clap for Colgate-Palmolive

$
0
0

Filed under:

Colgate-Palmolive (NYS: CL) reported earnings on July 25. Here are the numbers you need to know.

The 10-second takeaway
For the quarter ended June 30 (Q2), Colgate-Palmolive met expectations on revenues and met expectations on earnings per share.

Compared to the prior-year quarter, revenue increased slightly. Non-GAAP earnings per share grew. GAAP earnings per share dropped.


Gross margins grew, operating margins dropped, net margins dropped.

Revenue details
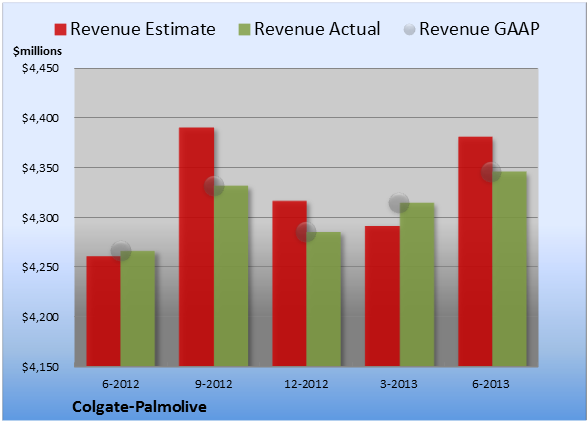
Colgate-Palmolive recorded revenue of $4.35 billion. The 14 analysts polled by S&P Capital IQ looked for sales of $4.38 billion on the same basis. GAAP reported sales were the same as the prior-year quarter's.

Source: S&P Capital IQ. Quarterly periods. Dollar amounts in millions. Non-GAAP figures may vary to maintain comparability with estimates.

EPS details
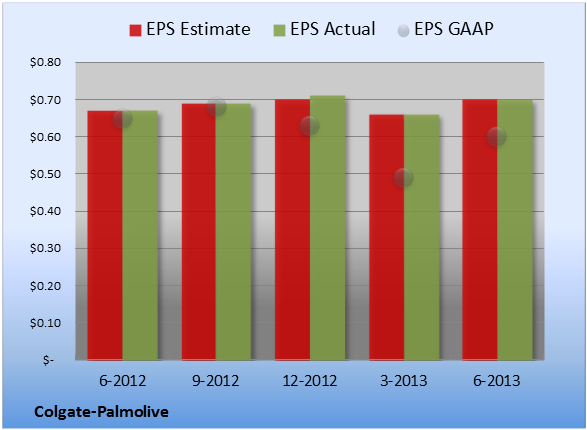
EPS came in at $0.70. The 18 earnings estimates compiled by S&P Capital IQ forecast $0.70 per share. Non-GAAP EPS of $0.70 for Q2 were 4.5% higher than the prior-year quarter's $0.67 per share. GAAP EPS of $0.60 for Q2 were 7.7% lower than the prior-year quarter's $0.65 per share.

Source: S&P Capital IQ. Quarterly periods. Non-GAAP figures may vary to maintain comparability with estimates.

Margin details
For the quarter, gross margin was 58.3%, 60 basis points better than the prior-year quarter. Operating margin was 20.8%, 250 basis points worse than the prior-year quarter. Net margin was 12.9%, 180 basis points worse than the prior-year quarter. (Margins calculated in GAAP terms.)

Looking ahead
Next quarter's average estimate for revenue is $4.49 billion. On the bottom line, the average EPS estimate is $0.73.

Next year's average estimate for revenue is $17.61 billion. The average EPS estimate is $2.98.

Investor sentiment
The stock has a five-star rating (out of five) at Motley Fool CAPS, with 1,334 members out of 1,382 rating the stock outperform, and 48 members rating it underperform. Among 489 CAPS All-Star picks (recommendations by the highest-ranked CAPS members), 480 give Colgate-Palmolive a green thumbs-up, and nine give it a red thumbs-down.

Of Wall Street recommendations tracked by S&P Capital IQ, the average opinion on Colgate-Palmolive is hold, with an average price target of $60.61.

Can your portfolio provide you with enough income to last through retirement? You'll need more than Colgate-Palmolive. Learn how to maximize your investment income and "Secure Your Future With 9 Rock-Solid Dividend Stocks." Click here for instant access to this free report.

The article Golf Clap for Colgate-Palmolive originally appeared on Fool.com.

Seth Jayson had no position in any company mentioned here at the time of publication. You can view his stock holdings here. He is co-advisor of Motley Fool Hidden Gems, which provides new small-cap ideas every month, backed by a real-money portfolio. The Motley Fool has no position in any of the stocks mentioned. Try any of our Foolish newsletter services free for 30 days. We Fools may not all hold the same opinions, but we all believe that considering a diverse range of insights makes us better investors. The Motley Fool has a disclosure policy.

Copyright © 1995 - 2013 The Motley Fool, LLC. All rights reserved. The Motley Fool has a disclosure policy.


Read | Permalink | Email this | Linking Blogs | Comments

Why Freeport-McMoRan Is Ready to Rebound

$
0
0

Filed under:

Based on the aggregated intelligence of 180,000-plus investors participating in Motley Fool CAPS, the Fool's free investing community, global mining giant Freeport-McMoRan has earned a respected four-star ranking.

With that in mind, let's take a closer look at Freeport and see what CAPS investors are saying about the stock right now.

Freeport facts

Headquarters (founded)

Phoenix, Ariz. (1987)

Market Cap

$27.4 billion

Industry

Diversified metals and mining

Trailing-12-Month Revenue

$17.8 billion

Management

CEO Richard Adkerson

CFO Kathleen Quirk

Return on Equity (average, past 3 years)

28.6%

Cash/Debt

$3.3 billion / $21.2 billion

Dividend Yield

4.4%

Competitors


Sources: S&P Capital IQ and Motley Fool CAPS.

On CAPS, 97% of the 6,014 members who have rated Freeport believe the stock will outperform the S&P 500 going forward.   

Earlier this month, one of those bulls, Skepikl, tapped Freeport as a particularly solid bargain opportunity:
Bouncing about its 52 week low. The recovery now underway could spell improving copper prices for this miner. VERY attractive P/E and [dividend yield] on paper may not be the going forward metrics, but offers some prospects of downside support.

If you want market-thumping returns, you need to put together the best portfolio you can. Of course, despite a strong four-star rating, Freeport may not be your top choice.

If you're interested in natural resources, then you owe it to yourself to discover the most precious resource in the history of the world. It's not gold. Or even oil. But it's more valuable than both of them. Combined. And here's the crazy part: one emerging company already has the market cornered... and stands to make in-the-know investors boatloads of cash. We reveal all in our special 100% FREE report "The 21st Century's Most Precious Natural Resource". Just click here for instant access!

The article Why Freeport-McMoRan Is Ready to Rebound originally appeared on Fool.com.

Fool contributor Brian Pacampara has no position in any stocks mentioned. The Motley Fool owns shares of Freeport-McMoRan Copper & Gold. Try any of our Foolish newsletter services free for 30 days. We Fools may not all hold the same opinions, but we all believe that considering a diverse range of insights makes us better investors. The Motley Fool has a disclosure policy.

Copyright © 1995 - 2013 The Motley Fool, LLC. All rights reserved. The Motley Fool has a disclosure policy.


Read | Permalink | Email this | Linking Blogs | Comments

General Motors Beats on EPS But GAAP Results Lag

$
0
0

Filed under:

General Motors (NYS: GM) reported earnings on July 25. Here are the numbers you need to know.

The 10-second takeaway
For the quarter ended June 30 (Q2), General Motors met expectations on revenues and beat expectations on earnings per share.

Compared to the prior-year quarter, revenue expanded slightly. Non-GAAP earnings per share dropped. GAAP earnings per share dropped significantly.


Margins contracted across the board.

Revenue details
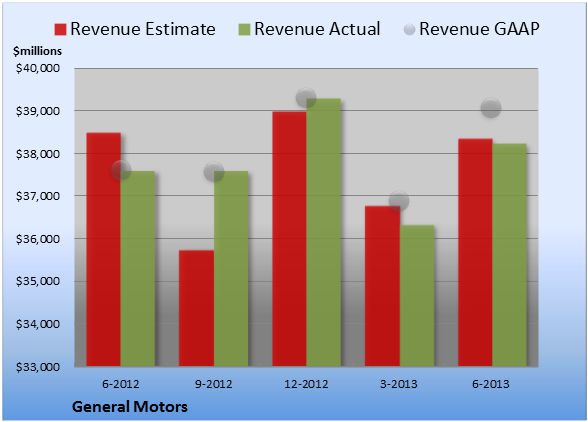
General Motors booked revenue of $38.24 billion. The 10 analysts polled by S&P Capital IQ anticipated revenue of $38.35 billion on the same basis. GAAP reported sales were the same as the prior-year quarter's.

Source: S&P Capital IQ. Quarterly periods. Dollar amounts in millions. Non-GAAP figures may vary to maintain comparability with estimates.

EPS details
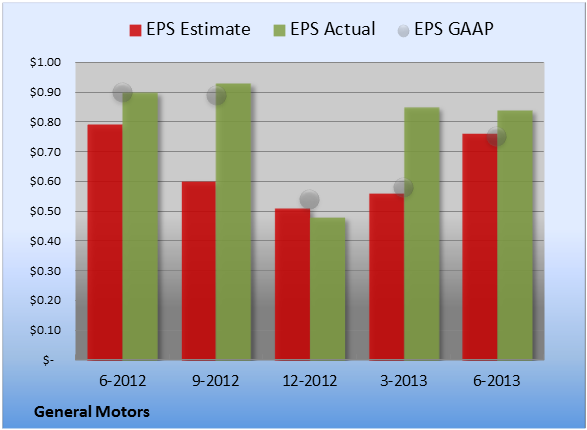
EPS came in at $0.84. The 18 earnings estimates compiled by S&P Capital IQ predicted $0.76 per share. Non-GAAP EPS of $0.84 for Q2 were 6.7% lower than the prior-year quarter's $0.90 per share. GAAP EPS of $0.75 for Q2 were 17% lower than the prior-year quarter's $0.90 per share.

Source: S&P Capital IQ. Quarterly periods. Non-GAAP figures may vary to maintain comparability with estimates.

Margin details
For the quarter, gross margin was 12.0%, 40 basis points worse than the prior-year quarter. Operating margin was 4.5%, 30 basis points worse than the prior-year quarter. Net margin was 3.6%, 130 basis points worse than the prior-year quarter. (Margins calculated in GAAP terms.)

Looking ahead
Next quarter's average estimate for revenue is $39.25 billion. On the bottom line, the average EPS estimate is $0.98.

Next year's average estimate for revenue is $155.17 billion. The average EPS estimate is $3.32.

Investor sentiment
The stock has a two-star rating (out of five) at Motley Fool CAPS, with 864 members out of 1,075 rating the stock outperform, and 211 members rating it underperform. Among 225 CAPS All-Star picks (recommendations by the highest-ranked CAPS members), 190 give General Motors a green thumbs-up, and 35 give it a red thumbs-down.

Of Wall Street recommendations tracked by S&P Capital IQ, the average opinion on General Motors is outperform, with an average price target of $40.33.

If you're looking for an edge in the transportation segment of the market, consider strong, smaller brands that sell their products to folks like you and me. We've got a couple to offer, plus a home-owner's trusted go-to company, in our new special report, "Middle-Class Millionaire-Makers: 3 Stocks Wall Street's Too Rich to Notice." Click here for instant access to this free report.

The article General Motors Beats on EPS But GAAP Results Lag originally appeared on Fool.com.

Seth Jayson had no position in any company mentioned here at the time of publication. You can view his stock holdings here. He is co-advisor of Motley Fool Hidden Gems, which provides new small-cap ideas every month, backed by a real-money portfolio. The Motley Fool recommends General Motors. Try any of our Foolish newsletter services free for 30 days. We Fools may not all hold the same opinions, but we all believe that considering a diverse range of insights makes us better investors. The Motley Fool has a disclosure policy.

Copyright © 1995 - 2013 The Motley Fool, LLC. All rights reserved. The Motley Fool has a disclosure policy.


Read | Permalink | Email this | Linking Blogs | Comments

Under Armour Beats on Both Top and Bottom Lines

$
0
0

Filed under:

Under Armour (NYS: UA) reported earnings on July 25. Here are the numbers you need to know.

The 10-second takeaway
For the quarter ended June 30 (Q2), Under Armour beat slightly on revenues and beat expectations on earnings per share.

Compared to the prior-year quarter, revenue grew significantly. GAAP earnings per share increased significantly.


Margins grew across the board.

Revenue details
Under Armour recorded revenue of $454.5 million. The 25 analysts polled by S&P Capital IQ expected a top line of $449.0 million on the same basis. GAAP reported sales were 23% higher than the prior-year quarter's $369.5 million.

Source: S&P Capital IQ. Quarterly periods. Dollar amounts in millions. Non-GAAP figures may vary to maintain comparability with estimates.

EPS details
EPS came in at $0.16. The 31 earnings estimates compiled by S&P Capital IQ averaged $0.13 per share. GAAP EPS of $0.16 for Q2 were 167% higher than the prior-year quarter's $0.06 per share.

Source: S&P Capital IQ. Quarterly periods. Non-GAAP figures may vary to maintain comparability with estimates.

Margin details
For the quarter, gross margin was 48.3%, 240 basis points better than the prior-year quarter. Operating margin was 7.1%, 390 basis points better than the prior-year quarter. Net margin was 3.9%, 210 basis points better than the prior-year quarter. (Margins calculated in GAAP terms.)

Looking ahead
Next quarter's average estimate for revenue is $708.1 million. On the bottom line, the average EPS estimate is $0.70.

Next year's average estimate for revenue is $2.24 billion. The average EPS estimate is $1.47.

Investor sentiment
The stock has a four-star rating (out of five) at Motley Fool CAPS, with 2,787 members out of 3,036 rating the stock outperform, and 249 members rating it underperform. Among 1,036 CAPS All-Star picks (recommendations by the highest-ranked CAPS members), 1,000 give Under Armour a green thumbs-up, and 36 give it a red thumbs-down.

Of Wall Street recommendations tracked by S&P Capital IQ, the average opinion on Under Armour is outperform, with an average price target of $60.88.

Selling to fickle consumers is a tough business for Under Armour or anyone else in the space. But some companies are better equipped to face the future than others. In a new report, we'll give you the rundown on three companies that are setting themselves up to dominate retail. Click here for instant access to this free report.

The article Under Armour Beats on Both Top and Bottom Lines originally appeared on Fool.com.

Seth Jayson owned shares of the following at the time of publication: Under Armour. You can view his stock holdings here. He is co-advisor of Motley Fool Hidden Gems, which provides new small-cap ideas every month, backed by a real-money portfolio. The Motley Fool recommends Under Armour. The Motley Fool owns shares of Under Armour. Try any of our Foolish newsletter services free for 30 days. We Fools may not all hold the same opinions, but we all believe that considering a diverse range of insights makes us better investors. The Motley Fool has a disclosure policy.

Copyright © 1995 - 2013 The Motley Fool, LLC. All rights reserved. The Motley Fool has a disclosure policy.


Read | Permalink | Email this | Linking Blogs | Comments

Encana Beats Up on Analysts Yet Again

$
0
0

Filed under:

Encana (NYS: ECA) reported earnings on July 25. Here are the numbers you need to know.

The 10-second takeaway
For the quarter ended June 30 (Q2), Encana crushed expectations on revenues and beat expectations on earnings per share.

Compared to the prior-year quarter, revenue expanded significantly. Non-GAAP earnings per share expanded significantly. GAAP earnings per share grew.


Margins increased across the board.

Revenue details
Encana booked revenue of $1.98 billion. The four analysts polled by S&P Capital IQ predicted sales of $1.46 billion on the same basis. GAAP reported sales were much higher than the prior-year quarter's $731.0 million.

Source: S&P Capital IQ. Quarterly periods. Dollar amounts in millions. Non-GAAP figures may vary to maintain comparability with estimates.

EPS details
EPS came in at $0.34. The 16 earnings estimates compiled by S&P Capital IQ forecast $0.18 per share. Non-GAAP EPS of $0.34 for Q2 were 26% higher than the prior-year quarter's $0.27 per share. GAAP EPS were $0.99 for Q2 versus -$2.01 per share for the prior-year quarter.

Source: S&P Capital IQ. Quarterly periods. Non-GAAP figures may vary to maintain comparability with estimates.

Margin details
For the quarter, gross margin was 64.6%, much better than the prior-year quarter. Operating margin was 40.0%, much better than the prior-year quarter. Net margin was 36.8%, much better than the prior-year quarter. (Margins calculated in GAAP terms.)

Looking ahead
Next quarter's average estimate for revenue is $1.53 billion. On the bottom line, the average EPS estimate is $0.28.

Next year's average estimate for revenue is $5.97 billion. The average EPS estimate is $0.94.

Investor sentiment
The stock has a four-star rating (out of five) at Motley Fool CAPS, with 1,098 members out of 1,129 rating the stock outperform, and 31 members rating it underperform. Among 195 CAPS All-Star picks (recommendations by the highest-ranked CAPS members), 190 give Encana a green thumbs-up, and five give it a red thumbs-down.

Of Wall Street recommendations tracked by S&P Capital IQ, the average opinion on Encana is hold, with an average price target of $21.40.

Is Encana the right energy stock for you? Read about a handful of timely, profit-producing plays on expensive crude in "3 Stocks for $100 Oil." Click here for instant access to this free report.

The article Encana Beats Up on Analysts Yet Again originally appeared on Fool.com.

Seth Jayson had no position in any company mentioned here at the time of publication. You can view his stock holdings here. He is co-advisor of Motley Fool Hidden Gems, which provides new small-cap ideas every month, backed by a real-money portfolio. The Motley Fool has no position in any of the stocks mentioned. Try any of our Foolish newsletter services free for 30 days. We Fools may not all hold the same opinions, but we all believe that considering a diverse range of insights makes us better investors. The Motley Fool has a disclosure policy.

Copyright © 1995 - 2013 The Motley Fool, LLC. All rights reserved. The Motley Fool has a disclosure policy.


Read | Permalink | Email this | Linking Blogs | Comments
Southwest Airlines Misses Where it Counts

$
0
0

Filed under:

Southwest Airlines (NYS: LUV) reported earnings on July 25. Here are the numbers you need to know.

The 10-second takeaway
For the quarter ended June 30 (Q2), Southwest Airlines met expectations on revenues and missed estimates on earnings per share.

Compared to the prior-year quarter, revenue grew slightly. Non-GAAP earnings per share expanded. GAAP earnings per share grew.


Gross margins increased, operating margins dropped, net margins dropped.

Revenue details
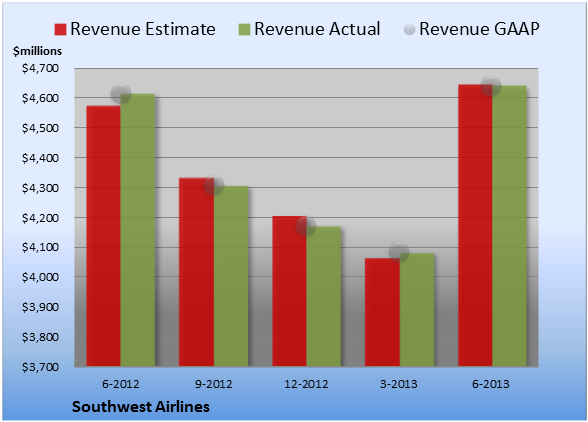
Southwest Airlines reported revenue of $4.64 billion. The 10 analysts polled by S&P Capital IQ wanted to see a top line of $4.65 billion on the same basis. GAAP reported sales were the same as the prior-year quarter's.

Source: S&P Capital IQ. Quarterly periods. Dollar amounts in millions. Non-GAAP figures may vary to maintain comparability with estimates.

EPS details
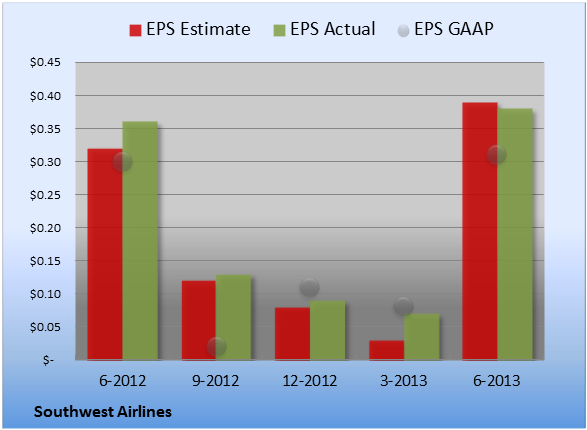
EPS came in at $0.38. The 15 earnings estimates compiled by S&P Capital IQ averaged $0.39 per share. Non-GAAP EPS of $0.38 for Q2 were 5.6% higher than the prior-year quarter's $0.36 per share. GAAP EPS of $0.31 for Q2 were 3.3% higher than the prior-year quarter's $0.30 per share.

Source: S&P Capital IQ. Quarterly periods. Non-GAAP figures may vary to maintain comparability with estimates.

Margin details
For the quarter, gross margin was 25.7%, 20 basis points better than the prior-year quarter. Operating margin was 9.9%, 30 basis points worse than the prior-year quarter. Net margin was 4.8%, 10 basis points worse than the prior-year quarter. (Margins calculated in GAAP terms.)

Looking ahead
Next quarter's average estimate for revenue is $4.45 billion. On the bottom line, the average EPS estimate is $0.28.

Next year's average estimate for revenue is $17.56 billion. The average EPS estimate is $0.99.

Investor sentiment
The stock has a three-star rating (out of five) at Motley Fool CAPS, with 1,536 members out of 1,797 rating the stock outperform, and 261 members rating it underperform. Among 406 CAPS All-Star picks (recommendations by the highest-ranked CAPS members), 358 give Southwest Airlines a green thumbs-up, and 48 give it a red thumbs-down.

Of Wall Street recommendations tracked by S&P Capital IQ, the average opinion on Southwest Airlines is outperform, with an average price target of $15.18.

Looking for alternatives to Southwest Airlines? It takes more than great companies to build a fortune for the future. Learn the basic financial habits of millionaires next door and get focused stock ideas in our free report, "3 Stocks That Will Help You Retire Rich." Click here for instant access to this free report.

The article Southwest Airlines Misses Where it Counts originally appeared on Fool.com.

Seth Jayson had no position in any company mentioned here at the time of publication. You can view his stock holdings here. He is co-advisor of Motley Fool Hidden Gems, which provides new small-cap ideas every month, backed by a real-money portfolio. The Motley Fool recommends Southwest Airlines. Try any of our Foolish newsletter services free for 30 days. We Fools may not all hold the same opinions, but we all believe that considering a diverse range of insights makes us better investors. The Motley Fool has a disclosure policy.

Copyright © 1995 - 2013 The Motley Fool, LLC. All rights reserved. The Motley Fool has a disclosure policy.


Read | Permalink | Email this | Linking Blogs | Comments

Air Products & Chemicals Adopts Poison Pill

$
0
0

Filed under:

Following what it referred to as, "unusual and substantial activity in the Company's shares," Air Products & Chemicals has implemented a shareholder rights plan, whereby each Air Products shareholder will receive a dividend of one warrant for each current share of stock owned on Aug. 5, 2013, the company announced today.

The Air Products rights plan is akin to a poison pill, which is structured to make an unsolicited takeover of the company prohibitively expense.

In this case, the warrants received as part of the rights plan are exercisable if "a person or group acquires beneficial ownership of 10 percent (or 20 percent in the case of institutional investors filing on Schedule 13G as described in the Rights Plan)," without approval of the Air Products' board, according to the press release. The same shareholder rights apply in the case of a merger.


Should the unapproved stock ownership percentage threshold be met, the warrants become exercisable, giving each shareholder the right to purchase "common shares having a market value of twice such price," the company said.

The Air Products shareholder rights plan is not in response to a takeover inquiry or proposal to acquire the company, according to Air Products, and will remain in force until July 24, 2014.

The article Air Products & Chemicals Adopts Poison Pill originally appeared on Fool.com.

Fool contributor Tim Brugger has no position in any stocks mentioned. The Motley Fool has no position in any of the stocks mentioned. Try any of our Foolish newsletter services free for 30 days. We Fools may not all hold the same opinions, but we all believe that considering a diverse range of insights makes us better investors. The Motley Fool has a disclosure policy.

Copyright © 1995 - 2013 The Motley Fool, LLC. All rights reserved. The Motley Fool has a disclosure policy.


Read | Permalink | Email this | Linking Blogs | Comments
The Gory Details on Potash Corp. of Saskatchewan's Double Fumble

$
0
0

Filed under:

Potash Corp. of Saskatchewan (NYS: POT) reported earnings on July 25. Here are the numbers you need to know.

The 10-second takeaway
For the quarter ended June 30 (Q2), Potash Corp. of Saskatchewan missed estimates on revenues and missed estimates on earnings per share.

Compared to the prior-year quarter, revenue contracted. GAAP earnings per share grew significantly.


Gross margins dropped, operating margins dropped, net margins grew.

Revenue details
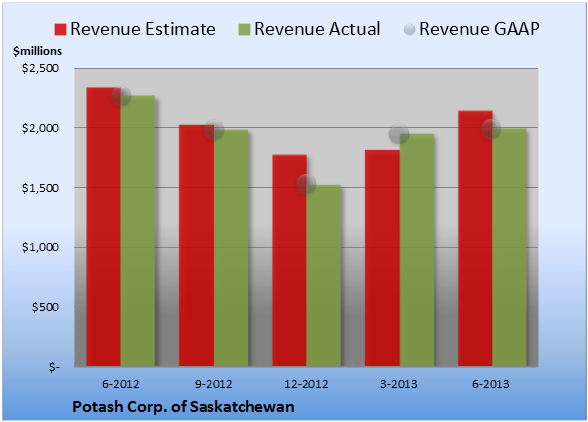
Potash Corp. of Saskatchewan logged revenue of $2.00 billion. The 16 analysts polled by S&P Capital IQ expected sales of $2.15 billion on the same basis. GAAP reported sales were 12% lower than the prior-year quarter's $2.27 billion.

Source: S&P Capital IQ. Quarterly periods. Dollar amounts in millions. Non-GAAP figures may vary to maintain comparability with estimates.

EPS details
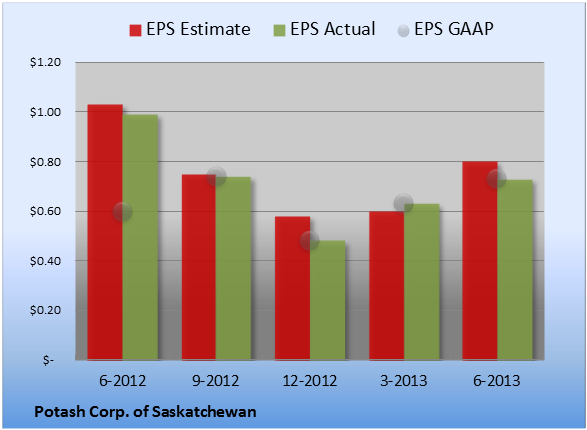
EPS came in at $0.73. The 25 earnings estimates compiled by S&P Capital IQ averaged $0.80 per share. GAAP EPS of $0.73 for Q2 were 22% higher than the prior-year quarter's $0.60 per share.

Source: S&P Capital IQ. Quarterly periods. Non-GAAP figures may vary to maintain comparability with estimates.

Margin details
For the quarter, gross margin was 49.0%, 370 basis points worse than the prior-year quarter. Operating margin was 41.9%, 490 basis points worse than the prior-year quarter. Net margin was 32.2%, 920 basis points better than the prior-year quarter. (Margins calculated in GAAP terms.)

Looking ahead
Next quarter's average estimate for revenue is $1.97 billion. On the bottom line, the average EPS estimate is $0.74.

Next year's average estimate for revenue is $7.90 billion. The average EPS estimate is $2.88.

Investor sentiment
The stock has a four-star rating (out of five) at Motley Fool CAPS, with 4,768 members out of 4,940 rating the stock outperform, and 172 members rating it underperform. Among 719 CAPS All-Star picks (recommendations by the highest-ranked CAPS members), 689 give Potash Corp. of Saskatchewan a green thumbs-up, and 30 give it a red thumbs-down.

Of Wall Street recommendations tracked by S&P Capital IQ, the average opinion on Potash Corp. of Saskatchewan is outperform, with an average price target of $46.52.

The rich are different than you and me: They might not notice the moneymaking stories right under our noses. In our new report, "Middle-Class Millionaire-Makers: 3 Stocks Wall Street's Too Rich to Notice," we give you three Peter Lynch-inspired buy-what-you-know stocks for the 99%. Click here for instant access to this free report.

The article The Gory Details on Potash Corp. of Saskatchewan's Double Fumble originally appeared on Fool.com.

Seth Jayson had no position in any company mentioned here at the time of publication. You can view his stock holdings here. He is co-advisor of Motley Fool Hidden Gems, which provides new small-cap ideas every month, backed by a real-money portfolio. The Motley Fool has no position in any of the stocks mentioned. Try any of our Foolish newsletter services free for 30 days. We Fools may not all hold the same opinions, but we all believe that considering a diverse range of insights makes us better investors. The Motley Fool has a disclosure policy.

Copyright © 1995 - 2013 The Motley Fool, LLC. All rights reserved. The Motley Fool has a disclosure policy.


Read | Permalink | Email this | Linking Blogs | Comments
Golf Clap for SIRIUS XM Radio

$
0
0

Filed under:

SIRIUS XM Radio (NAS: SIRI) reported earnings on July 25. Here are the numbers you need to know.

The 10-second takeaway
For the quarter ended June 30 (Q2), SIRIUS XM Radio met expectations on revenues and met expectations on earnings per share.

Compared to the prior-year quarter, revenue expanded. GAAP earnings per share dropped significantly.


Gross margins grew, operating margins expanded, net margins contracted.

Revenue details
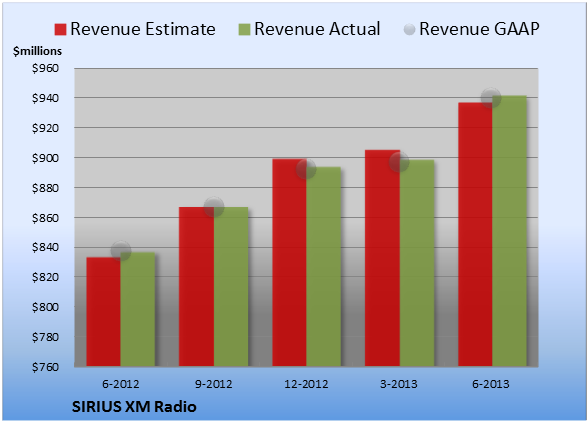
SIRIUS XM Radio chalked up revenue of $941.9 million. The 12 analysts polled by S&P Capital IQ wanted to see a top line of $937.1 million on the same basis. GAAP reported sales were 12% higher than the prior-year quarter's $837.5 million.

Source: S&P Capital IQ. Quarterly periods. Dollar amounts in millions. Non-GAAP figures may vary to maintain comparability with estimates.

EPS details
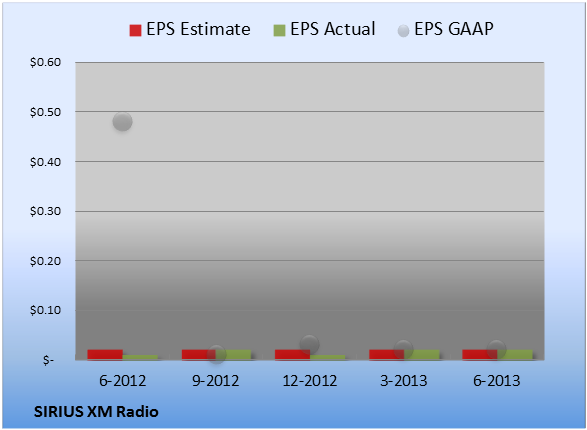
EPS came in at $0.02. The 13 earnings estimates compiled by S&P Capital IQ predicted $0.02 per share. GAAP EPS of $0.02 for Q2 were 96% lower than the prior-year quarter's $0.48 per share.

Source: S&P Capital IQ. Quarterly periods. Non-GAAP figures may vary to maintain comparability with estimates.

Margin details
For the quarter, gross margin was 57.5%, 690 basis points better than the prior-year quarter. Operating margin was 28.5%, 130 basis points better than the prior-year quarter. Net margin was 13.4%, much worse than the prior-year quarter. (Margins calculated in GAAP terms.)

Looking ahead
Next quarter's average estimate for revenue is $966.2 million. On the bottom line, the average EPS estimate is $0.02.

Next year's average estimate for revenue is $3.79 billion. The average EPS estimate is $0.09.

Investor sentiment
The stock has a two-star rating (out of five) at Motley Fool CAPS, with 4,589 members out of 5,567 rating the stock outperform, and 978 members rating it underperform. Among 802 CAPS All-Star picks (recommendations by the highest-ranked CAPS members), 611 give SIRIUS XM Radio a green thumbs-up, and 191 give it a red thumbs-down.

Of Wall Street recommendations tracked by S&P Capital IQ, the average opinion on SIRIUS XM Radio is outperform, with an average price target of $3.66.

Internet software and services are being consumed in radically different ways, on new and increasingly mobile devices. Is SIRIUS XM Radio on the right side of the revolution? Check out the changing landscape and meet the company that Motley Fool analysts expect to lead "The Next Trillion-dollar Revolution." Click here for instant access to this free report.

The article Golf Clap for SIRIUS XM Radio originally appeared on Fool.com.

Seth Jayson had no position in any company mentioned here at the time of publication. You can view his stock holdings here. He is co-advisor of Motley Fool Hidden Gems, which provides new small-cap ideas every month, backed by a real-money portfolio. The Motley Fool has no position in any of the stocks mentioned. Try any of our Foolish newsletter services free for 30 days. We Fools may not all hold the same opinions, but we all believe that considering a diverse range of insights makes us better investors. The Motley Fool has a disclosure policy.

Copyright © 1995 - 2013 The Motley Fool, LLC. All rights reserved. The Motley Fool has a disclosure policy.


Read | Permalink | Email this | Linking Blogs | Comments
Reap Dividends and Profits in Real Estate, the Easy Way

$
0
0

Filed under:

Exchange-traded funds offer a convenient way to invest in sectors or niches that interest you. If you'd like to add some real-estate stocks to your portfolio, but don't have the time or expertise to handpick a few, the Vanguard REIT Index ETF could save you a lot of trouble. Instead of trying to figure out which companies will perform best, you can use this ETF to invest in lots of them simultaneously.

The basics
ETFs often sport lower expense ratios than their mutual fund cousins. The Vanguard ETF's expense ratio -- its annual fee -- is a very low 0.10%. It also offers a significant dividend yield, recently near 3.6%.

This ETF has performed well, outstripping the world market over the past three, and five, years. As with most investments, of course, we can't expect outstanding performances in every quarter or year. Investors with conviction need to wait for their holdings to deliver.

Why real estate?
Perhaps because there's a finite amount of it, real estate tends to increase in value over time, though not always in a straight line. Real estate investment trusts (REITs), meanwhile, offer an extra benefit, via their requirement to pay out at least 90% of their income in the form of dividends.

More than a handful of real-estate companies had solid performances over the past year. Duke Realty surged 27%, for example, and yields 3.9%. The company specializes in industrial, health-care, and office properties. Its revenue hasn't been growing much in recent years, though, and its bottom line has been in the red (with a gain in the last quarter). The company's latest earnings report will be out next week, and its last one revealed rising occupancy levels and core funds from operations (FFO), as well as the refinancing of debt. Management has explained that it's repositioning its assets, in part by selling off suburban office properties.


Health Care REIT gained 13%, and yields 4.5%. It acquired Sunrise Senior Living, boosting its elder-care facility portfolio with units that command above-average rental rates. Meanwhile, same-store margins and occupancy rates have been growing. Obamacare will boost the number of people receiving medical care, and that's likely to help REITs such as this one, which focus on health-care properties. The REIT has grown aggressively via acquisitions, and now sports a market cap above $17 billion. That means, though, that its growth rate is likely to slow.

Realty Income advanced 12%, and yields 4.7%. It's a retail REIT, and rather dependable, recently upping its payout for the 72nd time since it went public in 1994, and making more than 500 consecutive monthly payments over several decades. The company just announced record operating results in its second quarter, with revenue jumping 63%, and FFO per share gained 22%. Occupancy rates rose, too, from 97%, to 98%. Recent acquisitions include American Realty Capital Trust. Trading near its 52-week high, it's not a screaming bargain right now.

Other companies didn't do as well last year, but could see their fortunes change in the coming years. HCP , focused on health-care properties, tacked on just 2%, and yields 4.5%. Like Health Care REIT, it has grown rather large (with a market capitalization topping $20 billion), and that can slow its growth rate. Some worry about health-care reforms possibly reducing profits from senior-serving properties, but HCP is relatively well positioned, with a significant portion of its patients paying for their own care. Another of its advantages is its focus on triple-net leases, where tenants pay for operating expenses.

The big picture
Demand for real estate isn't going away anytime soon. A well-chosen ETF can grant you instant diversification across any industry or group of companies -- and make investing in and profiting from it that much easier.

If you're looking for a compelling stock idea, check this out: The Motley Fool's chief investment officer has selected his No. 1 stock for this year. Find out which stock it is in the special free report: "The Motley Fool's Top Stock for 2013." Just click here to access the report and find out the name of this under-the-radar company.

The article Reap Dividends and Profits in Real Estate, the Easy Way originally appeared on Fool.com.

Longtime Fool contributor Selena Maranjian has no position in any stocks mentioned. The Motley Fool recommends Health Care REIT. Try any of our Foolish newsletter services free for 30 days. We Fools may not all hold the same opinions, but we all believe that considering a diverse range of insights makes us better investors. The Motley Fool has a disclosure policy.

Copyright © 1995 - 2013 The Motley Fool, LLC. All rights reserved. The Motley Fool has a disclosure policy.


Read | Permalink | Email this | Linking Blogs | Comments
Why Tempur Sealy Shares Collapsed

$
0
0

Filed under:

Although we don't believe in timing the market or panicking over market movements, we do like to keep an eye on big changes -- just in case they're material to our investing thesis.

What: Shares of Tempur Sealy International were getting squashed today, falling as much as 13% after delivering a disappointing second-quarter earnings report.

So what: The recently merged mattress maker said revenue doubled, thanks to the addition of Sealy, hitting $660.6 million, but that missed the Street's forecast at $662.8 million. Earnings per share also came up short at $0.36, against expectations of $0.40. Even worse, the company lowered its full-year EPS guidance to $2.25-$2.40 from $2.43-$2.45, as management said it's "taking longer than expected" to return the company to growth following the acquisition. Sales from continuing operations dropped 4.9% in the quarter.


Now what: The acquisition of Sealy was supposed to re-energize the company, but management still sees sales at the legacy Tempur North America falling 5% to 10%. The mattress industry may be due for further consolidation following the merger, as several players are competing for what appears to be a shrinking pie. Tempur-Pedic once dominated the market with its Memoryfoam mattress, but rivals have caught up in recent quarters. I'd approach the entire industry with caution, especially Tempur Sealy, which has now missed estimates several times of late.

Millions of Americans have waited on the sidelines since the market meltdown in 2008 and 2009, too scared to invest and put their money at further risk. Yet, those who've stayed out of the market have missed out on huge gains, and put their financial futures in jeopardy. In our brand-new special report, "Your Essential Guide to Start Investing Today," The Motley Fool's personal finance experts show you why investing is so important, and what you need to do to get started. Click here to get your copy today -- it's absolutely free.


The article Why Tempur Sealy Shares Collapsed originally appeared on Fool.com.

Fool contributor Jeremy Bowman has no position in any stocks mentioned. The Motley Fool owns shares of Tempur-Pedic International. Try any of our Foolish newsletter services free for 30 days. We Fools may not all hold the same opinions, but we all believe that considering a diverse range of insights makes us better investors. The Motley Fool has a disclosure policy.

Copyright © 1995 - 2013 The Motley Fool, LLC. All rights reserved. The Motley Fool has a disclosure policy.


Read | Permalink | Email this | Linking Blogs | Comments

Viewing all 9760 articles
Browse latest View live


Latest Images