Filed under: Investing
All too often investors focus on a company's income statement and completely ignore its cash flow statement. Doing so puts investors at risk because a company can earn money even while hemorrhaging cash. That used to describe Chesapeake Energy , which at one point spent $12 billion more than its $2.2 billion in operating cash flow . Today, Chesapeake's capital expenditures are much more in line with its cash flow, which can be illustrated via a cash flow analysis.
Drilling down into Chesapeake Energy's cash flow statement
In the first half of 2014, Chesapeake Energy produced $2.6 billion in cash flow from operations, even though the company only reported net income of $700 million. This discrepancy is regularly found at oil and gas companies because of the massive expenses these companies take each quarter. Let's look at Chesapeake's cash flow statement for the first six months of 2014 to see why the company's income is nearly $2 billion lower than its cash flow.

Source: Chesapeake Energy 10-Q for the second quarter of 2014.
We see here that Chesapeake Energy is adding back charges it took for depreciation, depletion, and amortization to the tune of $1.445 billion. That's on top of adding back in items such as deferred income tax expenses and derivatives. Add it all up and Chesapeake Energy's operations brought in $2.6 billion in cash during the opening half of this year, which is $400 million more than in the first six months of 2013.
A good portion of that cash was reinvested in the company's business. That is found in the next part of the company's cash flow statement, which details cash flow from investing activities.

Source: Chesapeake Energy 10-Q for the second quarter of 2014.
Here we see that the company's investing activities resulted in $1.7 billion in net cash being consumed through the first six months of 2014. The company spent nearly $2 billion to drill and complete wells, which is $1.1 billion less than it spent through the first six months of last year. Notably,Chesapeake Energy brought in $1.9 billion from asset sales in the first two quarters of 2013, but only sold $250 million in assets over that same period this year. This tells us the company invested within its operating cash flow rather than selling assets to fund drilling, which was Chesapeake's former funding mechanism. Overall, Chesapeake Energy had just over $850 million in free cash flow this quarter after adjusting for its investing activities.
The company used that excess cash flow to pay down some debt, pay dividends to investors, and bolster its cash position, as shown in this final snapshot of its cash flow statement.
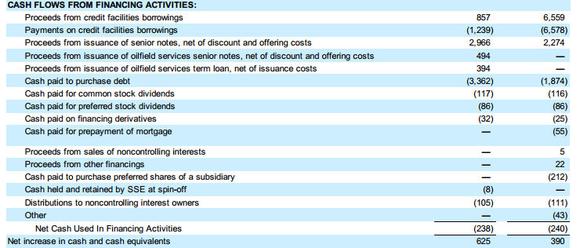
Source: Chesapeake Energy 10-Q for the second quarter of 2014.
Here we see that Chesapeake Energy paid down its credit facility by almost $400 million while also buying back $400 million of its debt. Most of that money came from debt issued from Seventy Seven Energy as part of Chesapeake's spinoff of that oilfield services business. That move was intended to improve Chesapeake Energy's balance sheet, which is exactly what we see happening. Overall, the company's cash flow and balance sheet are improved from last year, when the company increased its debt by $400 million.
The rest of the Chesapeake's excess cash flow this year either went to pay dividends to both common and preferred investors or to pad the company's cash balance by $625 million. That's a lot higher than the $390 million boost last year, which came entirely from the proceeds of a debt issuance.
Looking at Chesapeake Energy's cash flow shows that the company's underlying business produces a lot of cash. While a good portion of that cash is consumed by its investing activities, the company finally has some left over. It's using its leftover cash to bolster its balance sheet by paying down debt and increasing its cash position. Bottom line, Chesapeake Energy's cash flow is much improved from last year as the company's turnaround heads in the right direction.
"As significant as the discovery of oil itself!"
Recent research by the U.S. Energy Information Administration has already tabbed this "Oil Boom 2.0" with a downright staggering current value of $5.8 trillion. The Motley Fool just completed a brand-new investigative report on this significant investment topic and a single, under-the-radar company that has its hands tightly wrapped around the driving force that has allowed this boom to take off in the first place. Simply click here for access.
The article A Cash Flow Analysis of Chesapeake Energy Corporation Stock originally appeared on Fool.com.
Copyright © 1995 - 2014 The Motley Fool, LLC. All rights reserved. The Motley Fool has a disclosure policy.
Read | Permalink | Email this | Linking Blogs | Comments


