
The weakness in the company's mobile division was countered by the booming sales of its PlayStation 4 videogame console, which added up to a hefty, but not-as-bad-as-expected, loss. The company reported a 7 percent increase in overall sales this quarter, chiefly driven by the success of the PlayStation 4.
Without the write-down of its mobile business, Sony would have notched a profit, leading the company to suggest, once again, that it has turned the corner towards profitability. In addition to the strong sales from the videogame business, which jumped 83 percent compared to the previous year, sales also received an assist from the devices unit, which supplies Apple and other smartphone makers with image sensors, and even from its television unit, which has been unprofitable for years.
Sony has long made promises that it would turn itself around, but failed to deliver. The latest hurdle it faces is one largely beyond Sony's control: the weakness of the Japanese yen, which declined Friday as the Bank of Japan announced monetary-easing measures. According to CFO Kenichiro Yoshida, every time the value of the dollar increases by one yen versus the Japanese currency, the company loses 3 billion yen (about $26.4 million).
This earnings release follows the earnings announcements from the following peers of Sony Corporation: Canon Inc. (CAJ), Dolby Labs (DLB), Microsoft Corporation (MSFT), Panasonic Corporation (PCRFY), Royal Philips (PHG), Sharp Corporation (SHCAY), Toshiba Corporation (TOSBF) and Samsung Electronics (SSNLF).
(Note: We have used the US ADR's where available for our analysis.)
Highlights
- Summary numbers: Revenues of $ 18.3 billion, Net Earnings of $ -1.2 billion and EPS of $ -1.20.
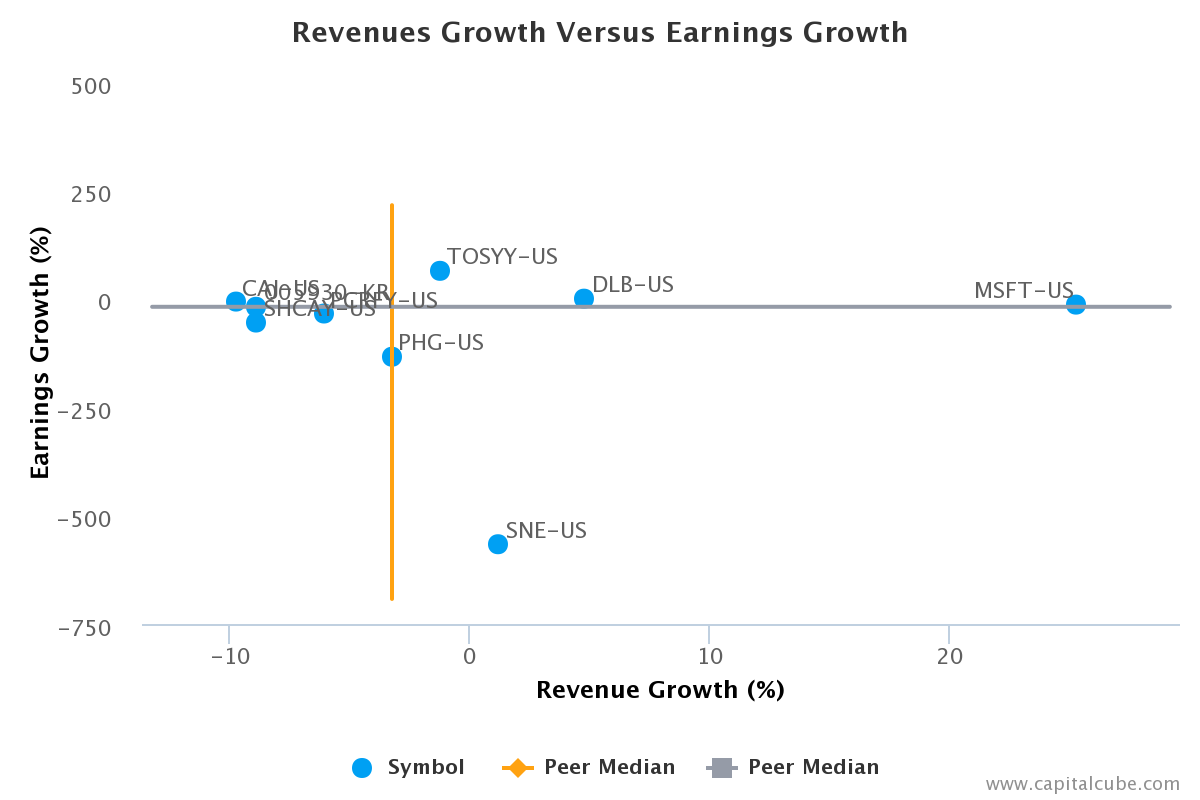
- Performance focus more on revenue than bottom-line: Change of revenue of 1.18 percent vs. loss in earnings of -566.0 percent compared to last year.
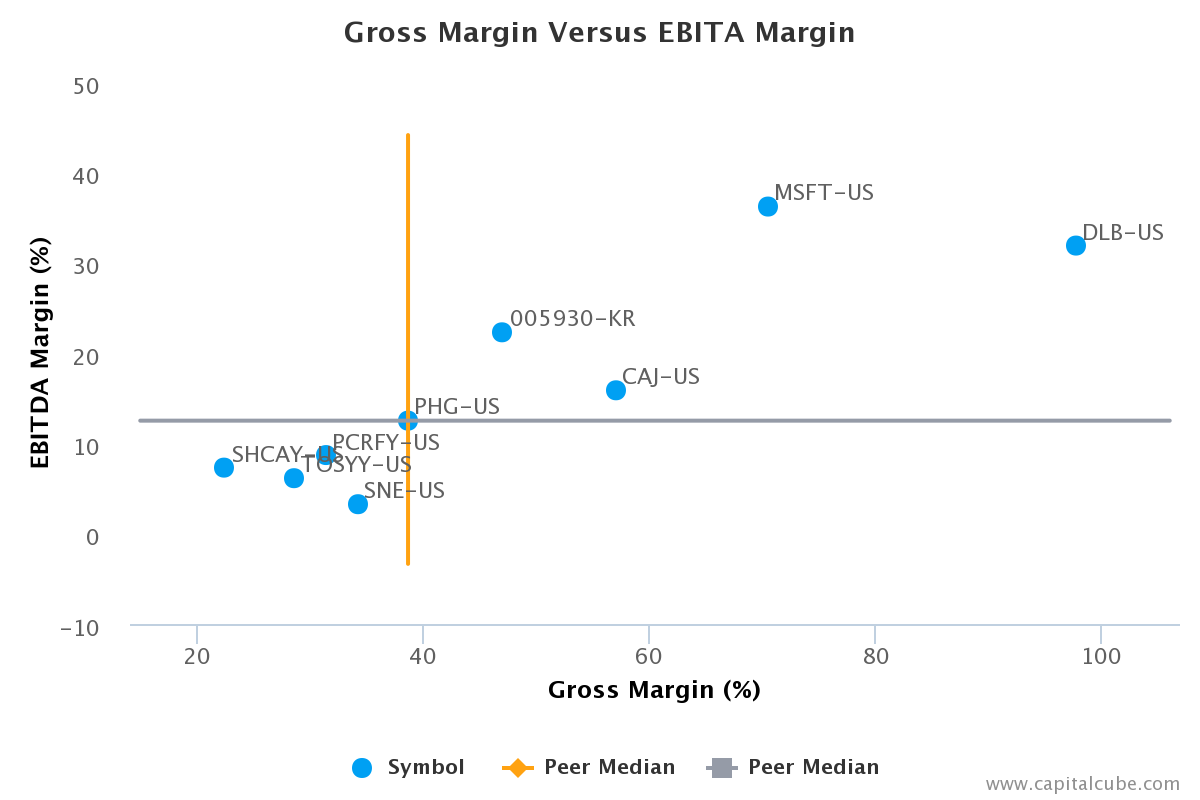
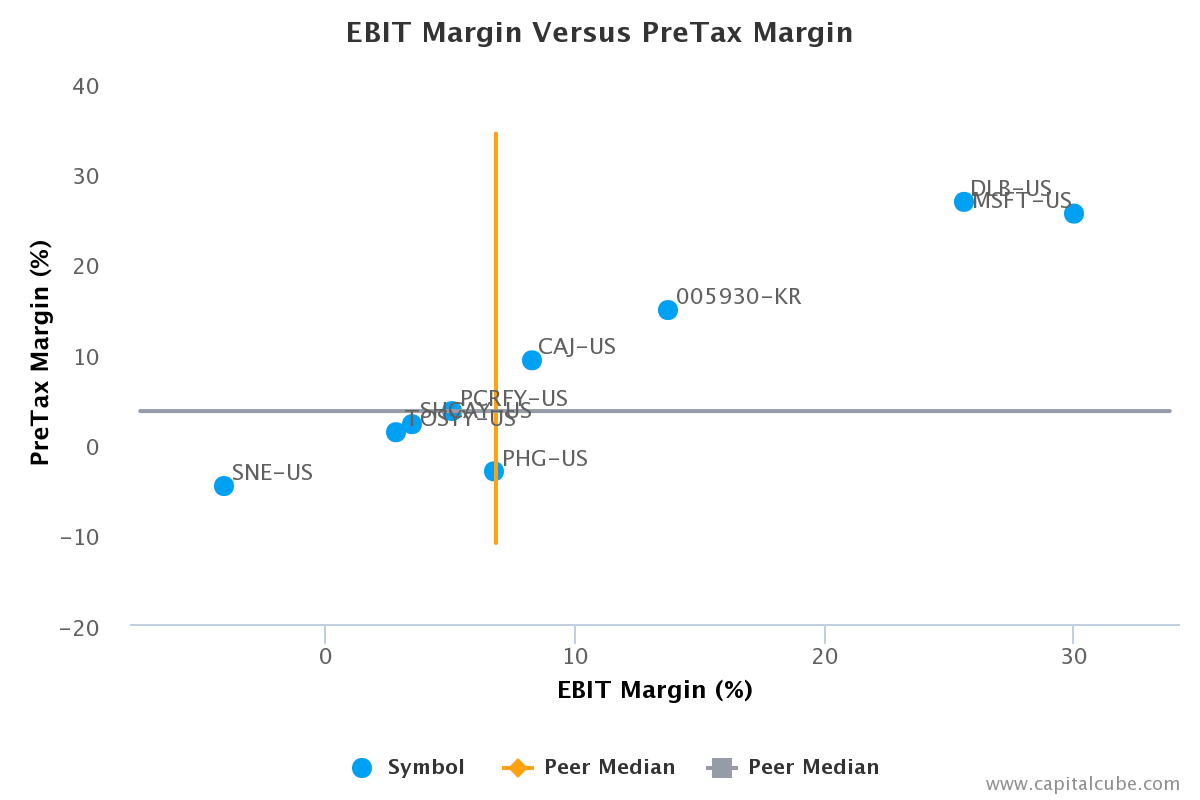
- Gross margins worsened to 34.25 percent from 38.23 percent compared to the same period last year, EBITDA margins now 3.26 percent from 8.36 percent.
- Earnings decline from operating margin decreases as well as from one-time write-down.
The table below shows the preliminary results and recent trends for key metrics such as revenues and net income (See complete table at the end of this report):
| Q3 2013 | Q4 2013 | Q1 2014 | Q2 2014 | Q3 2014 | |
| Revenue Growth (YOY) | -11.4% | 0.9% | -2.7% | 3.1% | 1.2% |
| Earnings Growth (YOY) | 0.2% | 304.1% | -234.3% | 651.2% | -566.0% |
| Net Margin | -1.1% | 1.1% | -7.5% | 1.5% | -7.2% |
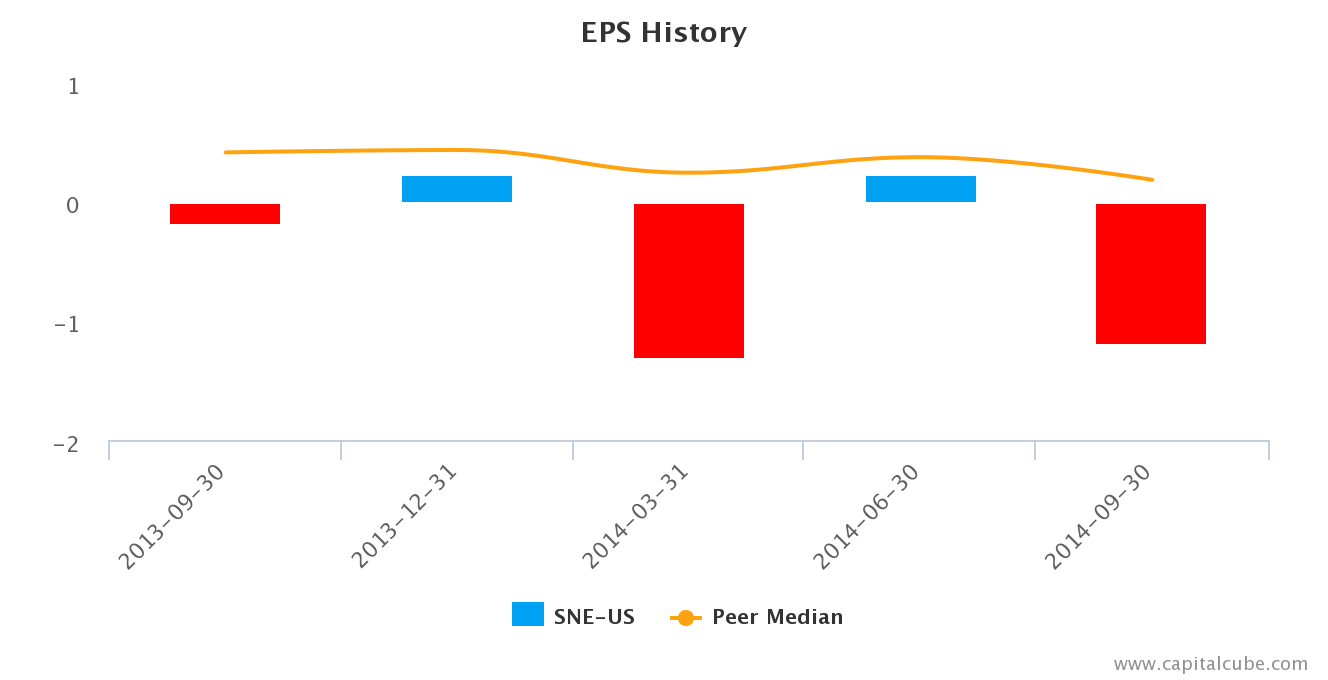
| EPS | -$0.19 | $0.23 | -$1.31 | $0.23 | -$1.20 |
| Return on Equity | -2.8% | 3.8% | -19.8% | 3.9% | -19.5% |
| Return on Assets | -0.5% | 0.7% | -3.7% | 0.7% | -3.6% |
Market Share Versus Profits
Companies sometimes focus on market share at the expense of profits or earnings growth.
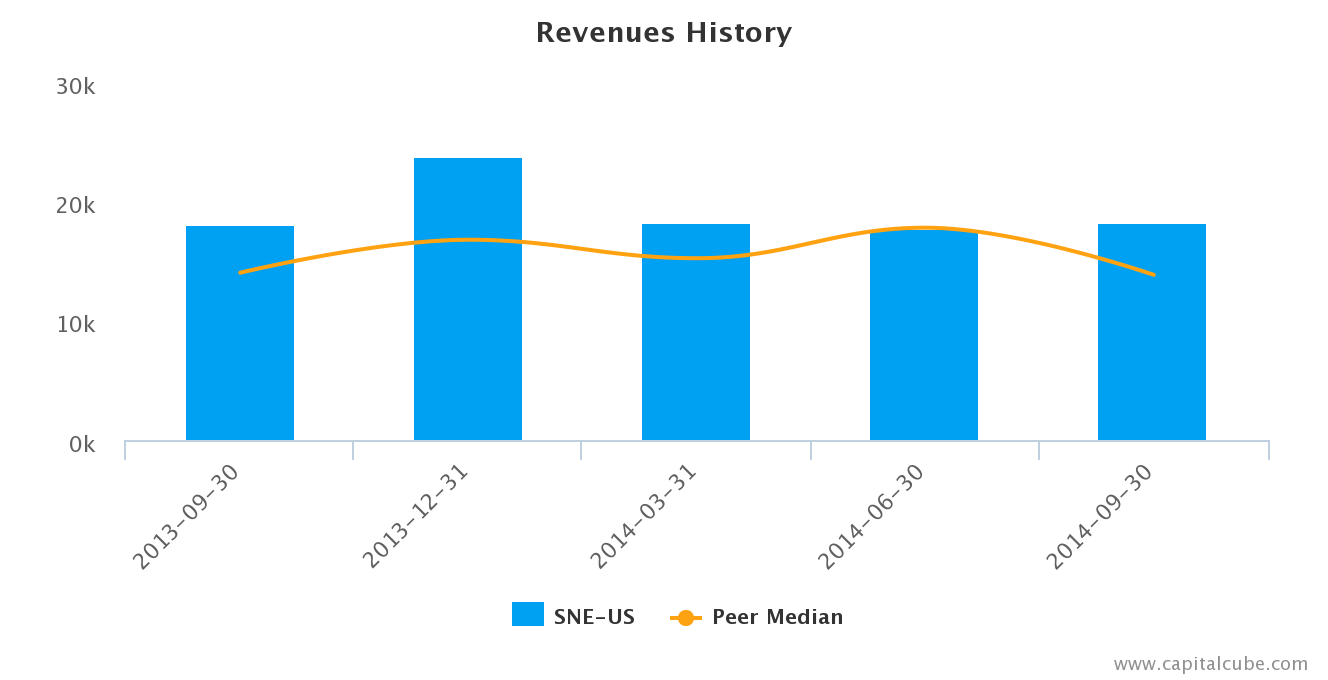
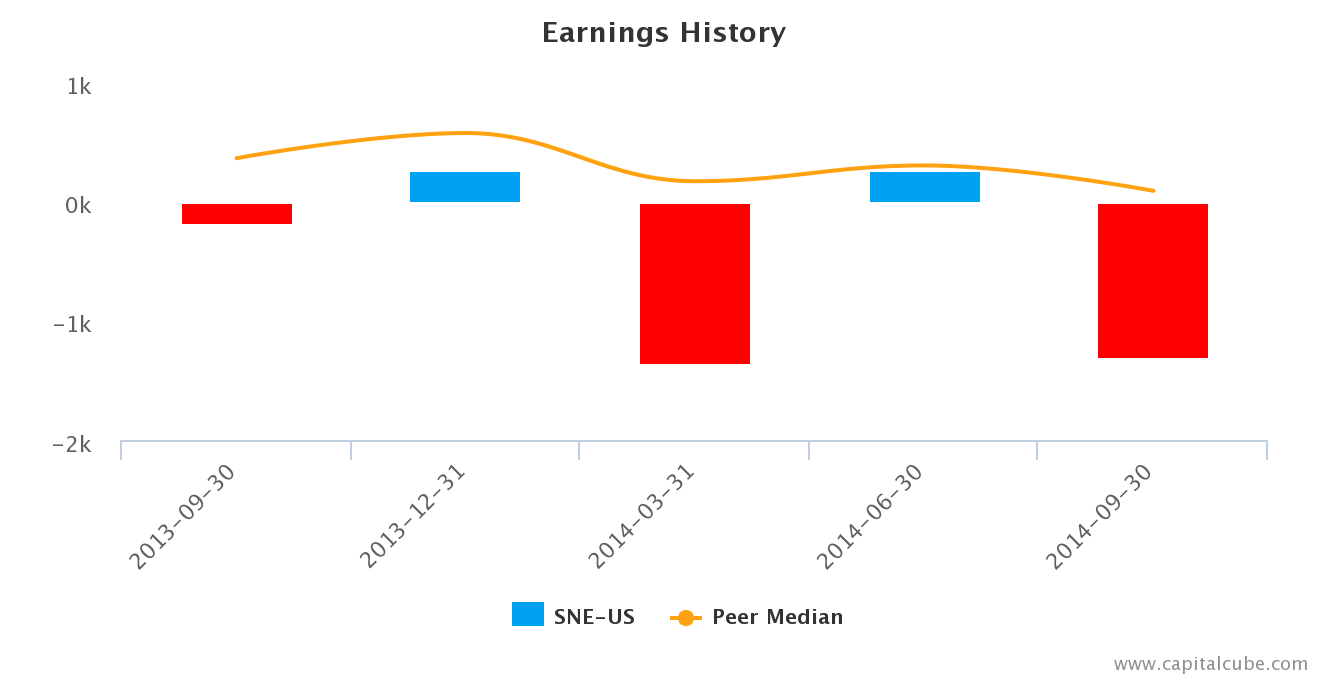
Sony's slight increase in revenue compared to the same period last year of 1.18 percent is considerably better than its change in earnings, which declined by -566.0 percent, suggesting that, among other problems, perhaps the company's focus is on the top-line at the expense of bottom-line earnings. However, this increase in revenue is better than the average of its peer group--pointing to some likely market share gains and slightly assuaging the weaker earnings performance this period. The quarter ended June 30, 2014 showed the same pattern, when revenues increased by 2.79 percent while earnings fell by -596.2 percent.
Earnings Growth Analysis
The company's decline in earnings compared to last year has been influenced by the following factors: (1) Worsening of gross margins performance from 38.23 percent to 34.25 percent and (2) issues with cost controls. As a result, operating margins (EBITDA margins) narrowed from 8.36 percent to 3.26 percent in this period. (For comparison, gross margins were 39.8 percent and EBITDA margins 11.2 percent in the previous last quarter.)
EPS and Earnings Change-Competitors?
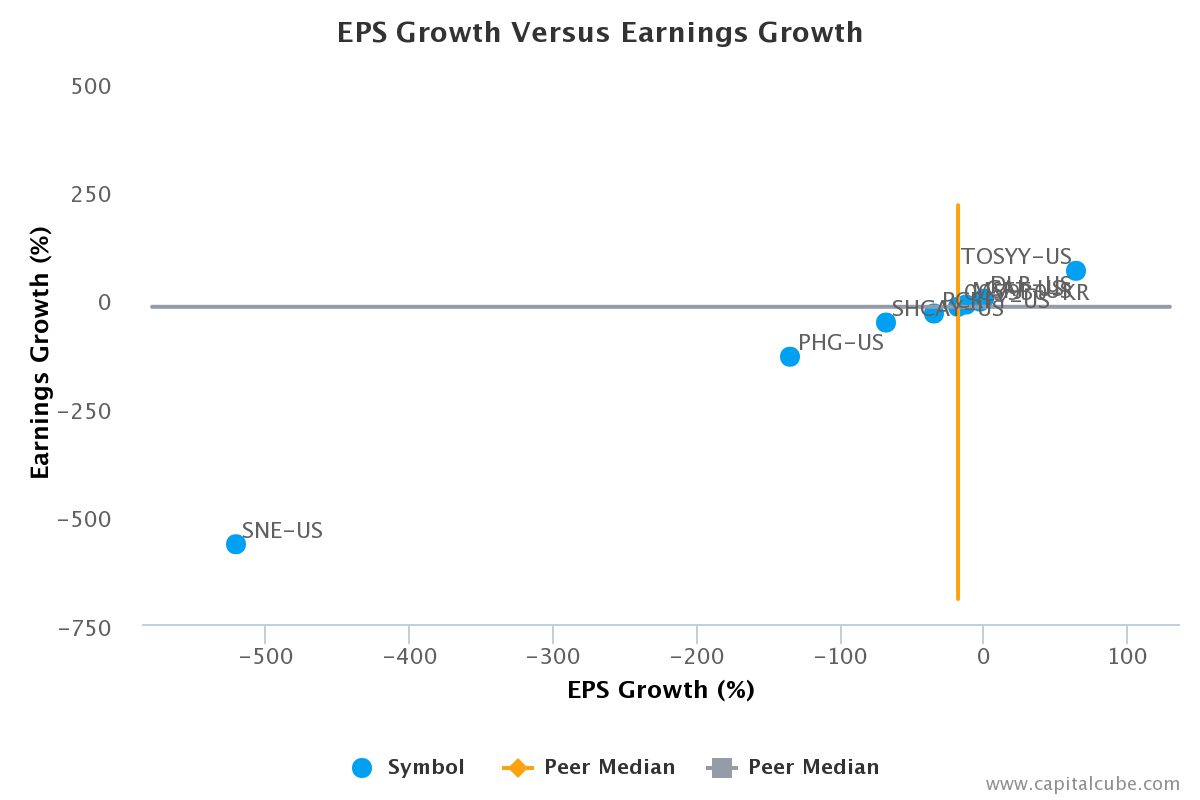
Compared to last year, Sony's fall in earnings of -566.0 percent is even worse than its Earnings per Share (EPS) decline of -521.1 percent. Not surprisingly, this earnings performance is worse than the average results announced thus far by its peer group, leading Capital Cube to conclude that not only is its earnings performance disappointing on an absolute basis, but the company is also losing ground in generating profits versus its competitors.
Supporting Data
The table below shows the preliminary results along with the recent trend for revenues, net income and other relevant metrics:
| Q3 2013 | Q4 2013 | Q1 2014 | Q2 2014 | Q3 2014 | |
| Revenue Growth (YOY) | -11.4% | 0.9% | -2.7% | 3.1% | 1.2% |
| Peer Average Revenue Growth (YOY) | -8.6% | -2.1% | -0.3% | 0.9% | -3.3% |
| Earnings Growth (YOY) | 0.2% | 304.1% | -234.3% | 651.2% | -566.0% |
| Peer Average Earnings Growth (YOY) | 50.0% | 2.8% | 5.2% | 7.3% | -18.5% |
| Gross Margin | 38.2% | 35.6% | 39.9% | 39.8% | 34.2% |
| Peer Average Gross Margin | 46.4% | 46.1% | 44.7% | 46.8% | 38.6% |
| EBITDA Margin | 8.4% | 9.9% | 6.5% | 11.2% | 3.3% |
| Peer Average EBITDA Margin | 15.1% | 16.2% | 11.4% | 12.4% | 12.5% |
| Net Margin | -1.1% | 1.1% | -7.5% | 1.5% | -7.2% |
| Peer Average Net Margin | 4.8% | 6.2% | 2.8% | 4.1% | 2.3% |
| EPS | -$0.19 | $0.23 | -$1.31 | $0.23 | -$1.20 |
| Peer Average EPS | $0.41 | $0.43 | $0.24 | $0.37 | $0.18 |
| Return on Equity | -2.8% | 3.8% | -19.8% | 3.9% | -19.5% |
| Peer Average Return on Equity | 12.4% | 15.1% | 5.0% | 9.5% | 10.5% |
| Return on Assets | -0.5% | 0.7% | -3.7% | 0.7% | -3.6% |
| Peer Average Return on Assets | 4.6% | 6.2% | 2.1% | 3.4% | 3.3% |
Company Profile
Sony Corp. is engaged in the development, design, manufacture, and sale of electronic equipment, instruments, devices, game consoles, music and entertainment, and software for consumers, professionals, and industrial markets. Its operations are carried out through the following segments: Consumer Products and Service; Professional, Device and Solutions; Pictures; Music; Financial Services; and Other. The Consumer Products and Service segment includes Sony Computer Entertainment, Sony Network Entertainment, VAIO & Mobile Business Group, Personal Imaging and Sound Business Group, and Home Entertainment Business Group. The Professional, Device and Solutions Group segment includes Professional Solutions Group, Device Solutions Business Group, and Semiconductor Business Group. The Pictures segment includes planning, production, and distribution of films and television programs. The Music segment includes planning, production, manufacture, and sale of music software; and production and sale of animation works. The Financial Service segment includes life insurance, damage insurance, banking, and credit finance businesses. The Other segment includes Blu-ray disc, DVD, and CD; Network Service-related Business, advertising agency business, and others. The company was founded by Akio Morita and Masaru Ibuka on May 7, 1946 and is headquartered in Tokyo, Japan.
CapitalCube does not own any shares in the stocks mentioned and focuses solely on providing unique fundamental research and analysis on approximately 50,000 stocks and ETFs globally. Try any of our analysis, screener or portfolio premium services free for 7 days. To get a quick preview of our services, check out our free quick summary analysis of SNE.