Filed under: Earnings, Walt Disney

The Disney film division's outsized performance led the way to overall revenue and profits. The success of animated movie "Frozen" and Marvel movie "Guardians of the Galaxy" lifted movie revenue beyond expectations. Revenue from the Studio division was up 18 percent to $12.4 billion in the fiscal fourth quarter. Frozen, which became the highest grossing animated film ever, also generated merchandising revenue, which lifted up fourth quarter product sales in the consumer division by 7 percent to $1.1 billion.
Other Disney divisions also had higher revenue. The revenue from media and cable networks rose 5 percent to $5.2 billion; and the revenue from parks and resorts rose 7 percent to $1.1 billion.
The results were ahead of analysts' estimates, with the overall revenue number slightly better than expected. Despite that, Disney's stock fell slightly after the earnings report, although it has nearly doubled in price in the last two years.
This earnings release follows the earnings announcements from the following peers of Walt Disney Company: CBS Corporation (CBS), Comcast Corporation (CMCSA), Discovery Communications (DISCA), DreamWorks Animation (DWA), Twenty-First Century Fox (FOXA), Sony Corporation (SNE) and Time Warner (TWX).
Highlights
- Summary numbers: Revenues of $12.4 billion, Net Earnings of $1.6 billion and EPS of $0.86.
- Performance focus on earnings: Same period yearly change in earnings of 7.5 percent, better than change in revenues of 7.1 percent
- Ability to declare a higher earnings number? Increase in operating cash flow of 13.5 percent compared to same time last year better than change in earnings.
The table below shows the preliminary results and recent trends for key metrics such as revenues and net income (See complete table at the end of this report):
| Q3 2013 | Q4 2013 | Q1 2014 | Q2 2014 | Q3 2014 | |
| Revenue Growth (YOY) | 7.3% | 8.4% | 10.1% | 7.8% | 7.1% |
| Earnings Growth (YOY) | 12.1% | 33.1% | 26.7% | 21.5% | 7.5% |
| Net Margin | 12.1% | 15.0% | 16.5% | 18.0% | 12.1% |
| EPS | $0.77 | $1.03 | $1.08 | $1.28 | $0.86 |
| Return on Equity | 11.9% | 15.4% | 16.2% | 18.7% | 12.4% |
| Return on Assets | 6.9% | 9.0% | 9.3% | 10.8% | 7.1% |
Market Share Versus Earnings Growth
Companies sometimes focus on growing market share at the expense of profits.


The Disney Company's 7.1 percent increase in revenue, compared to the same period last year, trailed its increase in earnings, which rose 7.5 percent. The company's performance this period and for its full fiscal year suggests a focus on boosting the bottom-line earnings. While the revenue performance could be even higher, it is important to note that Disney's revenue performance is among the best in its peer group thus far. (Also, for comparison purposes, revenues fell by -0.5 percent and earnings by -33.2 percent compared to the immediate last quarter.)

Gross Margin Trend
Companies sometimes sacrifice improvements in revenues and margins in order to extend better terms to customers and vendors. Capital Cube checks for such activity by comparing gross margin changes with any changes in working capital. If the gross margins improved without a worsening of working capital days, it is quite possible that the company's performance is a result of truly delivering in the marketplace and not simply an accounting prop.

Disney's decline in gross margins is offset by some improvements on the balance sheet side. Working capital management shows progress. The company's working capital days have gone down to 5.8 from 18.2 for the same period last year, and suggest that the gross margin decline is not altogether bad.

Operating Cash Flow Growth Versus Earnings Growth-Sustainable?
Companies often post earnings numbers that are influenced by non-cash activities, which may not be sustainable. One way to gauge the quality of the declared earnings number is to judge the deviation in earnings growth from the growth in operating cash flows. In general, an earnings growth rate that is superior to operating cash flow growth implies a higher proportion of non-operating or one-time activities. Such activities are typically not sustainable over long periods.

Disney's year-on-year increase in operating cash flow of 13.5 percent beat its change in earnings, suggesting that the company might have been able to declare a higher earnings number. In addition, this increase in operating cash flow is better than average among the declared results thus far in its peer group.

Margins
The company's earnings growth has also been influenced by the following factors: (1) Improvements in operating (EBIT) margins from 18.7 percent to 19.3 percent and (2) one-time accounting items. The company's pretax margins are now 19.9 percent compared to 19.2 percent for the same period last year.
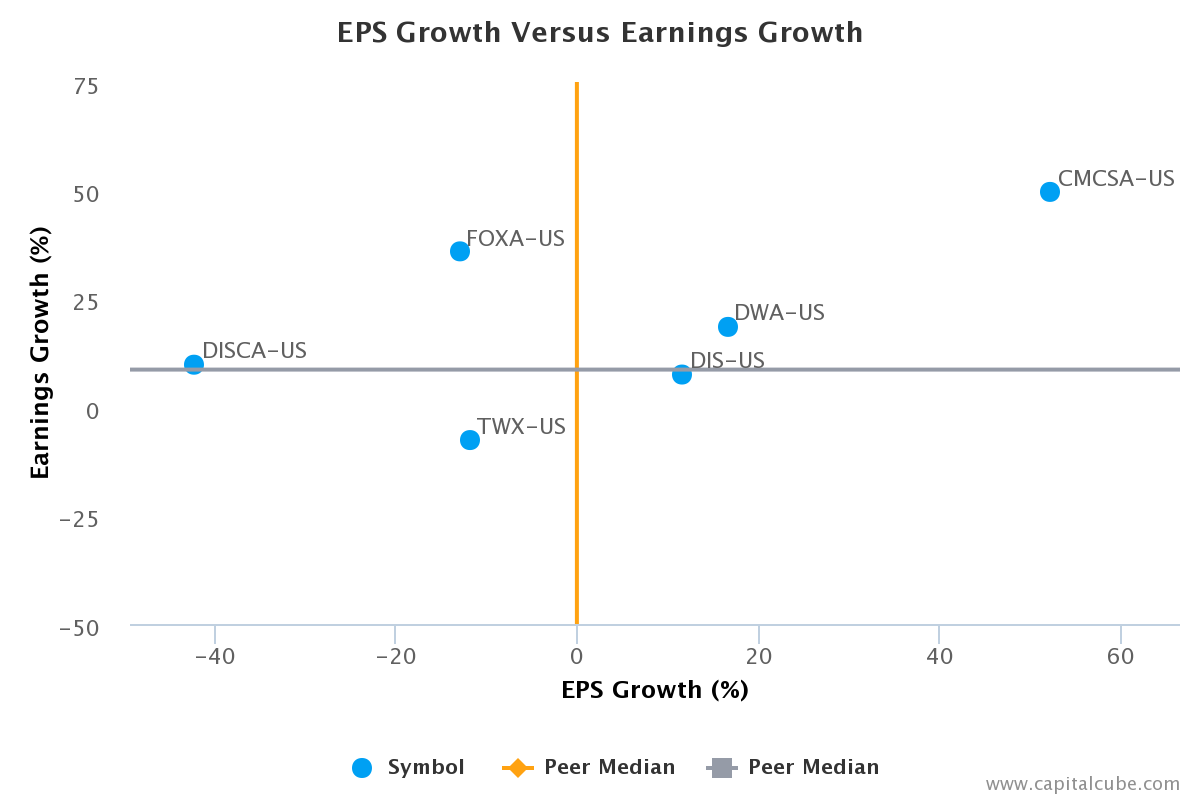
EPS Growth Versus Earnings Growth
Disney's year-on-year change in Earnings per Share (EPS) of 11.7 percent is better than its change in earnings of 7.5 percent. However, Capital Cube concludes that the company is gaining ground in generating profits compared to its peers because the 7.5 percent rise in earnings is better than the peer average.

Supporting Data
The table below shows the preliminary results along with the recent trend for revenues, net income and other relevant metrics:
| Q3 2013 | Q4 2013 | Q1 2014 | Q2 2014 | Q3 2014 | |
| Revenue Growth (YOY) | 7.3% | 8.4% | 10.1% | 7.8% | 7.1% |
| Peer Average Revenue Growth (YOY) | -1.1% | 5.3% | 9.0% | 3.3% | 5.5% |
| Earnings Growth (YOY) | 12.1% | 33.1% | 26.7% | 21.5% | 7.5% |
| Peer Average Earnings Growth (YOY) | 6.1% | 27.3% | 0.5% | 12.1% | 8.7% |
| Gross Margin | 23.5% | 26.2% | 30.6% | 32.6% | 19.3% |
| Peer Average Gross Margin | 44.5% | 40.8% | 40.3% | 41.7% | 42.7% |
| Net Margin | 12.1% | 15.0% | 16.5% | 18.0% | 12.1% |
| Peer Average Net Margin | 11.5% | 11.7% | 12.6% | 12.1% | 12.7% |
| EPS | $0.77 | $1.03 | $1.08 | $1.28 | $0.86 |
| Peer Average EPS | $0.60 | $0.74 | $0.69 | $0.76 | $0.67 |
| Return on Equity | 11.9% | 15.4% | 16.2% | 18.7% | 12.4% |
| Peer Average Return on Equity | 13.8% | 15.1% | 15.5% | 16.5% | 11.8% |
| Return on Assets | 6.9% | 9.0% | 9.3% | 10.8% | 7.1% |
| Peer Average Return on Assets | 6.1% | 6.4% | 6.6% | 5.7% | 6.3% |
Company Profile
The Walt Disney Co. together with its subsidiaries and affiliates is a diversified international family entertainment and media enterprise. It operates through five business segments: Media Networks, Parks & Resorts, Studio Entertainment, Consumer Products and Interactive Media. The Media Networks segment is comprised of a domestic broadcast television network, television production and distribution operations, domestic television stations, international and domestic cable networks, domestic broadcast radio networks and stations, and publishing and digital operations. This segment operates through consolidated subsidiaries, the ESPN, Disney Channels Worldwide, ABC Family, SOAPnet and UTV/Bindass networks. This segment also operates ABC Television Network and television stations, as well as the ESPN Radio Network, Radio Disney Network and owns and operates radio stations. Additionally, it operates ABC, ESPN, ABC Family and SOAPnet-branded internet businesses. The Parks & Resorts segment owns and operates the Walt Disney World Resort in Florida and the Disneyland Resort in California. Its Walt Disney World Resort includes four theme parks-the Magic Kingdom, Epcot, Disney's Hollywood Studios and Disney's Animal Kingdom; resort hotels, retail, dining, and entertainment complex, a sports complex, conference centers, campgrounds, water parks, and other recreational facilities. The segment's Disneyland Resort includes two theme parks-Disneyland and Disney California Adventure; resort hotels, and a retail, dining and entertainment complex. This segment's Walt Disney Imagineering unit designs and develops theme park concepts and attractions, as well as resort properties. The Studio Entertainment segment produces and acquires live-action and animated motion pictures for worldwide distribution to the theatrical, home entertainment, and television markets. This segment distributes these products through its own distribution and marketing companies in the United States and through independent companies and joint ventures in foreign markets primarily under the Walt Disney Pictures, Touchstone Pictures, Pixar, Marvel, and Disneynature banners. The Consumer Products segment licenses trade names, characters and visual and literary properties to various manufacturers, retailers, show promoters, and publishers throughout the world. This segment also engages in retail and online distribution of products through The Disney Store and DisneyStore.com. It also publishes entertainment and educational books and magazines and comic books for children and families and operates English language learning centers in China. The Interactive Media segment creates and delivers branded entertainment and lifestyle content across interactive media platforms. Its primary operating businesses are Games which produces and distributes console, online and mobile games; and Online, which develops branded online services in the United States and internationally. The Walt Disney was founded by Walter Elias Disney on October 16, 1923 and is headquartered in Burbank, CA.
CapitalCube does not own any shares in the stocks mentioned and focuses solely on providing unique fundamental research and analysis on approximately 50,000 stocks and ETFs globally. Try any of our analysis, screener or portfolio premium services free for 7 days. To get a quick preview of our services, check out our free quick summary analysis of DIS.https://online.capitalcube.com/#!/stock/us/nyse/dis


